Upcoming Event Austin FinOps Executive Dinner - Register to Join
The rule identifies all underutilized AWS DynamoDB tables. For optimal capacity and cost optimization, nOps recommends you consider lowering the read and write capacity mode. You may also consider switching it from Provisioned Mode to On-Demand Mode.
This rule can help you with the following
By default, nOps considers a DynamoDB table as “underutilized” when the number of read/write capacity units (RCUs and WCUs) consumed is 30% lower than the number of provisioned read/write capacity units set for a table over a specified time period.
The following AWS CloudWatch metrics can be helpful to detect such underused DynamoDB Tables:
ProvisionedReadCapacityUnits – the number of provisioned read capacity units for a DynamoDB table (Units: Count).ConsumedReadCapacityUnits – the number of read capacity units consumed over the specified time period (Units: Count).ProvisionedWriteCapacityUnits – the number of provisioned write capacity units for a DynamoDB table (Units: Count).ConsumedWriteCapacityUnits – the number of write capacity units consumed over the specified time period (Units: Count).When you create a DynamoDB Table in Provisioned Mode, you are charged for the Provisioned Read/Write Capacity regardless of whether you consume them or not. However, when you create a DynamoDB table in On-Demand mode, you pay only for the capacity you use.
In Provisioned mode, you can also make use of
AutoScalingfeature where you can specify a minimum capacity and a maximum capacity. DynamoDB can then scale your Provisioned Capacity Units based on scaling configuration. This feature is discussed in a separate rule page.
Perform the following steps to detect any DynamoDB tables with underutilized read/write capacity in your AWS account:
1. Sign in and access the DynamoDB dashboard at https://console.aws.amazon.com/dynamodb/.
2. Under the Dashboard section by the left, click on the Tables option.
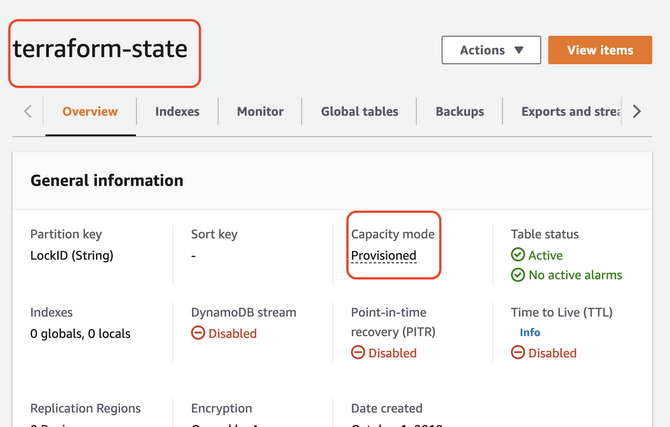
3. Select and copy the name of the desired DynamoDB table that you wish to examine its capacity mode. For Example, we will examine a table named terraform-state in our AWS account
4. Next, head over to the CloudWatch dashboard at https://console.aws.amazon.com/cloudwatch/.
5. Under the Metrics section by the left, click the All Metrics option.
6. Scroll down to the All Metrics tab and select DynamoDB and Table Metrics after that to access the metrics available for your DynamoDB tables.
7. As shown below, use the search function to access the metrics for the table name that you copied in Step 4 i.e, terraform-state.

8. Next, select the ProvisionedReadCapacityUnits and ConsumedReadCapacityUnits entries to get the provisioned and consumed read capacity usage data. After that, use the topmost menu to set the graph type to Number and the period to Relative, 1 week.
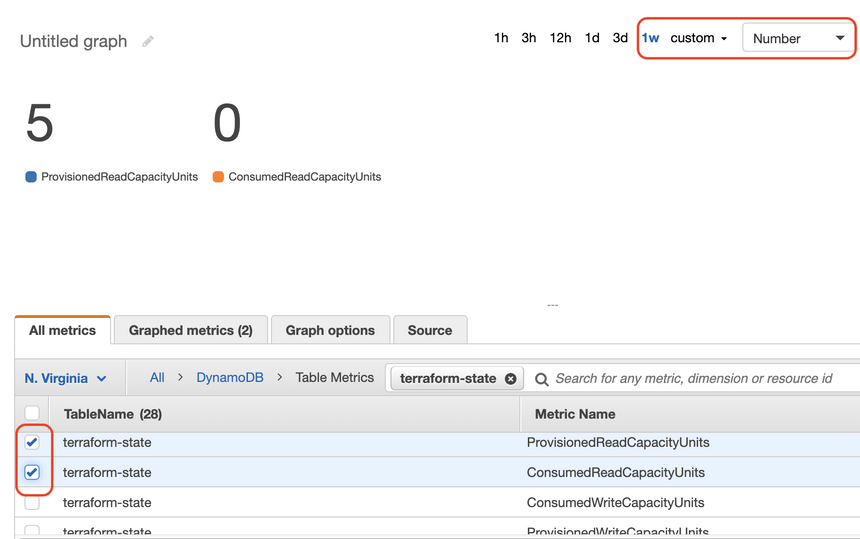
9. Verify the numbers returned and check if ConsumedReadCapacityUnits is 30% less than ProvisionedReadCapacityUnits. If yes, then the table read capacity is underutilized and can be lowered.
10. Next, we need to repeat steps 9 and 10 to find out the Write Capacity Usage. As shown below, select ProvisionedWriteCapacityUnits and ConsumedWriteCapacityUnits to get the usage data for the provisioned and consumed write capacity. After that, use the topmost menu to set the graph type to Number and the period to Relative, 1 week. Just like we did in the previous stage.
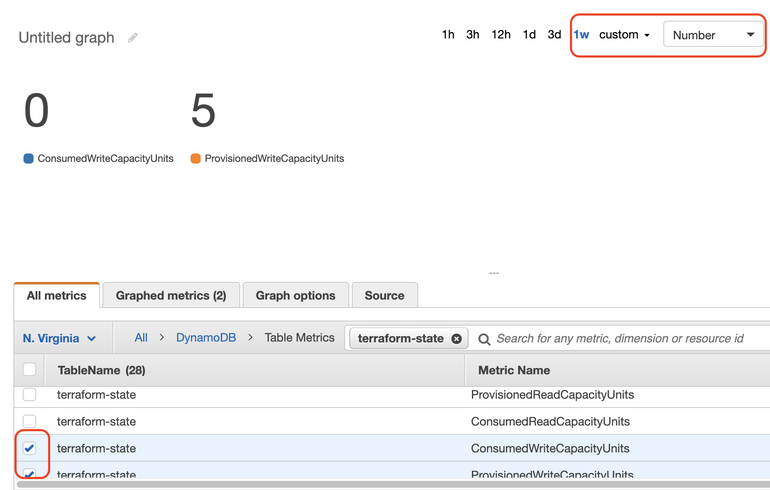
11. Verify the numbers returned and check if ConsumedWriteCapacityUnits is 30% less than ProvisionedWriteCapacityUnits. If yes, then the table read capacity is underutilized and can be lowered.
If the checks above revealed that both total read capacity and write capacity must be lowered, then you can also consider switching the table from
provisionedmode toon-demandmode.
12. Repeat steps 4 – 12 to verify the provisioned and the consumed read/write capacity for other DynamoDB tables available in the current region.
13. Switch the AWS region at the top navigation bar and repeat the entire audit procedure for the remaining regions you have provisioned DB resources in.
1. Run the list-tables command to retrieve the list of all DynamoDB tables provisioned in the specified region. Below is a sample output:
aws dynamodb list-tables \\ --region us-east-1 \\ --query 'TableNames' **Output** [ ... "terrafom-lock", "terraform-lock", "terraform-state", "terraform-state-rp", ... ]2. Choose a table name from the output list and execute the get-metric-statistics command to retrieve the statistics recorded by CloudWatch for the following metrics.
a. ProvisionedReadCapacityUnits
b. ConsumedReadCapacityUnits
Choose the start-time and end-time to see the data captured over the last 1 hour using a time interval of **3600 seconds** as the granularity of the data points. Use the sample below as a guide.
**Query 1** aws cloudwatch get-metric-statistics \\ --region us-east-1 \\ --metric-name ProvisionedReadCapacityUnits \\ --start-time 2021-10-24T12:00:00 \\ --end-time 2021-10-30T12:00:00 \\ --period 3600 \\ --namespace AWS/DynamoDB \\ --statistics Average \\ --dimensions Name=TableName,Value=terraform-state **Output** { "Label": "ProvisionedReadCapacityUnits", "Datapoints": [ { "Timestamp": "2021-10-28T18:00:00+00:00", "Average": 5.0, "Unit": "Count" }, { "Timestamp": "2021-10-25T11:00:00+00:00", "Average": 5.0, "Unit": "Count" }, { "Timestamp": "2021-10-26T00:00:00+00:00", "Average": 5.0, "Unit": "Count" }, ... { "Timestamp": "2021-10-24T19:00:00+00:00", "Average": 5.0, "Unit": "Count" }, { "Timestamp": "2021-10-29T11:00:00+00:00", "Average": 5.0, "Unit": "Count" }, { "Timestamp": "2021-10-26T04:00:00+00:00", "Average": 5.0, "Unit": "Count" } ] } **Query 2** aws cloudwatch get-metric-statistics \\ --region us-east-1 \\ --metric-name ConsumedReadCapacityUnits \\ --start-time 2021-10-24T12:00:00 \\ --end-time 2021-10-30T12:00:00 \\ --period 3600 \\ --namespace AWS/DynamoDB \\ --statistics Average \\ --dimensions Name=TableName,Value=terraform-state Output { "Label": "ConsumedReadCapacityUnits", "Datapoints": [ { "Timestamp": "2021-10-28T18:00:00+00:00", "Average": 0.0, "Unit": "Count" }, { "Timestamp": "2021-10-25T11:00:00+00:00", "Average": 0.0, "Unit": "Count" }, { "Timestamp": "2021-10-26T00:00:00+00:00", "Average": 0.0, "Unit": "Count" }, ... { "Timestamp": "2021-10-24T19:00:00+00:00", "Average": 0.0, "Unit": "Count" }, { "Timestamp": "2021-10-29T11:00:00+00:00", "Average": 0.0, "Unit": "Count" }, { "Timestamp": "2021-10-26T04:00:00+00:00", "Average": 0.0, "Unit": "Count" } ] }3. Verify the numbers returned and check if ConsumedReadCapacityUnits is 30% less than ProvisionedReadCapacityUnits. If yes, then the table read capacity is underutilized and can be lowered.
4. Next, execute the get-metric-statistics command again to get the statistics recorded by CloudWatch for the following metrics.
a. ProvisionedWriteCapacityUnits
b. ConsumedWriteCapacityUnits
Again, choose the start-time and end-time to see the data captured over the last 1 hour using a time interval of **3600 seconds** as the granularity of the data points. Use the sample below as a guide.
**Query 1** aws cloudwatch get-metric-statistics \\ --region us-east-1 \\ --metric-name ProvisionedWriteCapacityUnits \\ --start-time 2021-10-24T12:00:00 \\ --end-time 2021-10-30T12:00:00 \\ --period 3600 \\ --namespace AWS/DynamoDB \\ --statistics Average \\ --dimensions Name=TableName,Value=terraform-state **Output** { "Label": "ProvisionedWriteCapacityUnits", "Datapoints": [ { "Timestamp": "2021-10-28T18:00:00+00:00", "Average": 5.0, "Unit": "Count" }, { "Timestamp": "2021-10-25T11:00:00+00:00", "Average": 5.0, "Unit": "Count" }, { "Timestamp": "2021-10-26T00:00:00+00:00", "Average": 5.0, "Unit": "Count" }, ... { "Timestamp": "2021-10-24T19:00:00+00:00", "Average": 5.0, "Unit": "Count" }, { "Timestamp": "2021-10-29T11:00:00+00:00", "Average": 5.0, "Unit": "Count" }, { "Timestamp": "2021-10-26T04:00:00+00:00", "Average": 5.0, "Unit": "Count" } ] } **Query 2** aws cloudwatch get-metric-statistics \\ --region us-east-1 \\ --metric-name ConsumedWriteCapacityUnits \\ --start-time 2021-10-24T12:00:00 \\ --end-time 2021-10-30T12:00:00 \\ --period 3600 \\ --namespace AWS/DynamoDB \\ --statistics Average \\ --dimensions Name=TableName,Value=terraform-state **Output** { "Label": "ConsumedWriteCapacityUnits", "Datapoints": [ { "Timestamp": "2021-10-28T18:00:00+00:00", "Average": 0.0, "Unit": "Count" }, { "Timestamp": "2021-10-25T11:00:00+00:00", "Average": 0.0, "Unit": "Count" }, { "Timestamp": "2021-10-26T00:00:00+00:00", "Average": 0.0, "Unit": "Count" }, ... { "Timestamp": "2021-10-24T19:00:00+00:00", "Average": 0.0, "Unit": "Count" }, { "Timestamp": "2021-10-29T11:00:00+00:00", "Average": 0.0, "Unit": "Count" }, { "Timestamp": "2021-10-26T04:00:00+00:00", "Average": 0.0, "Unit": "Count" } ] }5. Verify the numbers returned and check if ConsumedWriteCapacityUnits is 30% less than ProvisionedWriteCapacityUnits. If yes, then the table read capacity is underutilized and can be lowered.
If the checks above revealed that both total read capacity and write capacity must be lowered then you can also consider switching the table from
**provisioned**mode to**on-demand**mode.
6. Repeat steps 1 – 5 to verify the provisioned and the consumed read/write capacity for other DynamoDB tables available in the current region.
7. To ascertain the state of provisioned DB tables in other regions, update the AWS region by changing the **--region** value and and repeat the entire audit procedure for the tables provisioned in such region.
To remediate the underutilized DynamoDB table, you can either:
(a.) change it to on-demand mode.
(b.) lower the total read/ write capacity for the concerned table or
1. Access the DynamoDB dashboard at https://console.aws.amazon.com/dynamodb/.
2. Under the Dashboard section by the left, select the Tables option.
3. Next, select the DynamoDB table you would like to reconfigure (see Audit section part I on identifying the right resource).
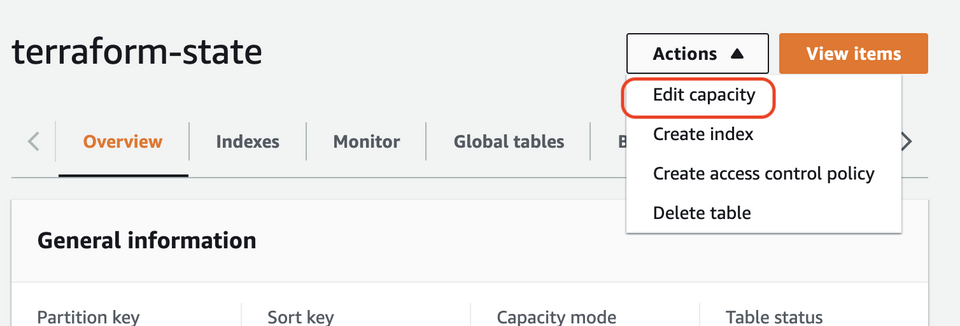
4. Select the top Actions drop-down menu and choose the Edit Capacity option as shown below.
5. As previously mentioned, you have two options:
a. Change the Capacity Mode from Provisioned to On-Demand and save Changes
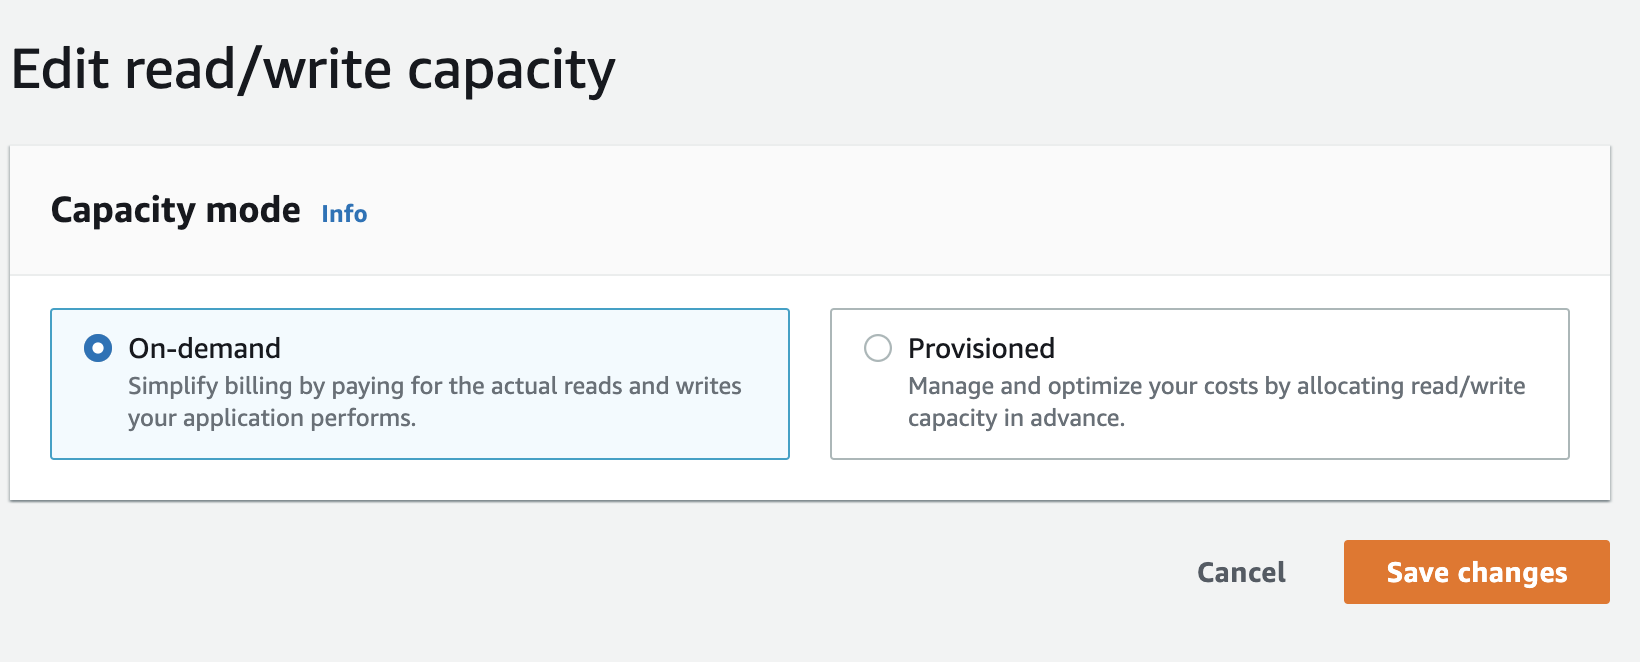
Note that as soon as you update to On-Demand Mode, all other Capacity Configuration options disappear since you will now pay for only what you use.
b. Lower the Provisioned Read and Write Capacity of the table: In the Edit read/write capacity form, scroll down and enter the new values for Provisioned capacity units in both Read Capacity and Write Capacity sections according to your requirements and click on Save Changes.
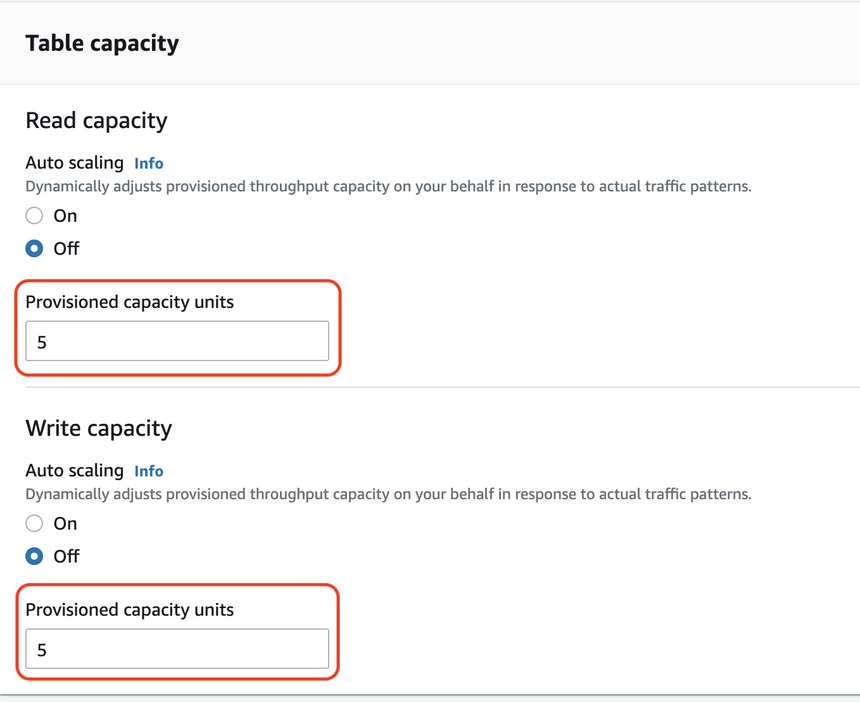
You would also see options to turn on
Auto Scalingfeature forRead and Write Capacityif you are interested in enabling it.
6. Repeat steps no. 4 – 6 to modify the capacity configuration for other Amazon DynamoDB tables provisioned within the current region.
7. Change the AWS region from the navigation bar and repeat the process for other regions.
Option 1: Change the capacity mode to On-Demand
1. Execute the **update-table** command with the identified table name in the Audit section and change the —billing-mode value to PAY_PER_REQUEST.
**Query** aws dynamodb update-table \\ --region us-east-1 \\ --table-name terraform-state \\ --billing-mode PAY_PER_REQUEST **Output** { "TableDescription": { "AttributeDefinitions": [ { "AttributeName": "LockID", "AttributeType": "S" } ], "TableName": "terraform-state", "KeySchema": [ { "AttributeName": "LockID", "KeyType": "HASH" } ], "TableStatus": "UPDATING", "CreationDateTime": "2019-10-01T07:15:01.711000+10:00", "ProvisionedThroughput": { "LastIncreaseDateTime": "2021-11-06T06:57:24.586000+11:00", "LastDecreaseDateTime": "2021-11-06T07:01:06.127000+11:00", "NumberOfDecreasesToday": 1, "ReadCapacityUnits": 0, "WriteCapacityUnits": 0 }, "TableSizeBytes": 501, "ItemCount": 5, "TableArn": "arn:aws:dynamodb:us-east-1:695292474035:table/terraform-state", "TableId": "e289bbc1-a144-4872-a1d6-6763bf15d85d", "BillingModeSummary": { "BillingMode": "PAY_PER_REQUEST" } } }2. Run the wait table exists waiter command to re-activate the table.
aws dynamodb wait table-exists \\ --region us-east-1 \\ --table-name terraform-state **Output** Returns no output but waits for table to become active3. Perform step 1 on other DynamoDB tables available in the current region to modify their provisioned read/write capacity.
4. Update the — region parameter to modify the capacity mode of other regions’ tables.
Option 2: Lower the Provisioned Read / Write Capacity
1. To configure the new capacity units, run the update-table command with the identified table name (in the Audit section) and —provisioned-throughput parameter as shown below.
**Query** aws dynamodb update-table \\ --region us-east-1 \\ --table-name terraform-state \\ --provisioned-throughput ReadCapacityUnits=3,WriteCapacityUnits=3 **Output** { "TableDescription": { "AttributeDefinitions": [ { "AttributeName": "LockID", "AttributeType": "S" } ], "TableName": "terraform-state", "KeySchema": [ { "AttributeName": "LockID", "KeyType": "HASH" } ], "TableStatus": "UPDATING", "CreationDateTime": "2019-10-01T07:15:01.711000+10:00", "ProvisionedThroughput": { "LastDecreaseDateTime": "2021-11-06T06:56:05.237000+11:00", "NumberOfDecreasesToday": 0, "ReadCapacityUnits": 5, "WriteCapacityUnits": 5 }, "TableSizeBytes": 501, "ItemCount": 5, "TableArn": "arn:aws:dynamodb:us-east-1:695292474035:table/terraform-state", "TableId": "e289bbc1-a144-4872-a1d6-6763bf15d85d" } }2. Run the wait table exists waiter command to re-activate the table.
aws dynamodb wait table-exists \\ --region us-east-1 \\ --table-name terraform-state **Output** Returns no output but waits for table to become active3. Perform step 1 on other DynamoDB tables available in the current region to modify their provisioned read/write capacity.
4. Update the -- region parameter to modify other regions’ tables.