 Skip to content


- Blog
- Announcement
- New Kubernetes Insights and Cluster Rightsizing Recommendations
New Kubernetes Insights and Cluster Rightsizing Recommendations
Monitor & reduce Kubernetes spend with comprehensive and actionable cost visibility and insights
As teams increasingly adopt Kubernetes, they face challenges in visualizing and efficiently optimizing clusters within complex containerized environments.
Most teams manage these complexities with a combination of manual monitoring, third-party tools, and basic metrics provided by native Kubernetes dashboards — requiring them to switch between different tools and analyze data from multiple sources.
Our recent study of over $2.5m annual EKS spend found more than 78% of usage was wasted due to over-provisioning.
It’s not always easy to look into your clusters and pinpoint the waste. To help you take action on this significant opportunity to optimize, we designed a comprehensive solution.
What’s New
Now you can get comprehensive visibility and optimization recommendations into Kubernetes clusters in one unified dashboard including:
- Critical metrics for pricing optimization, utilization rates, waste optimization down to the pod, node or container level
- Total visibility into hidden fees like extended support, control plane charges, etc.
- Useful insights to tune your cluster that you can act on from day 1
This isn’t just another monitoring tool; it’s a powerful all-in-one suite designed to transform how you interact with your Kubernetes environment to optimize cluster performance and costs. Let’s explore the key features.
Understand your clusters at a glance
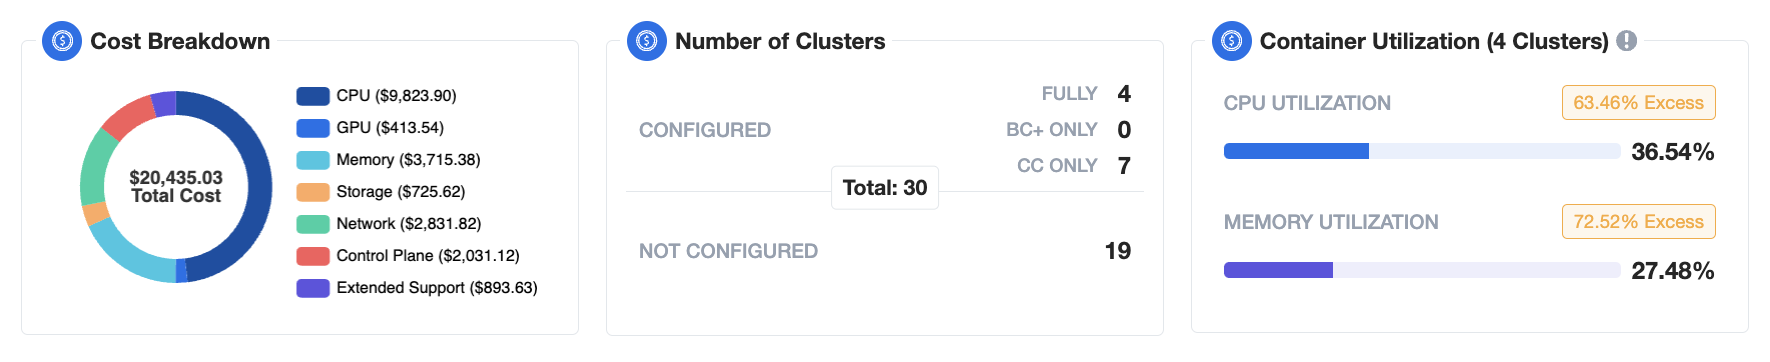
View your cost breakdown, number of clusters, and the utilization of your containers (with node utilization coming soon). This helps you to easily and quickly assess the scale of your clusters and the distribution of workloads, providing a holistic snapshot of overall cluster utilization and where your costs are coming from.
For example, you might not be aware that you’re spending $900 a month in Extended Support; with the nOps dashboard, it is obvious at a glance.
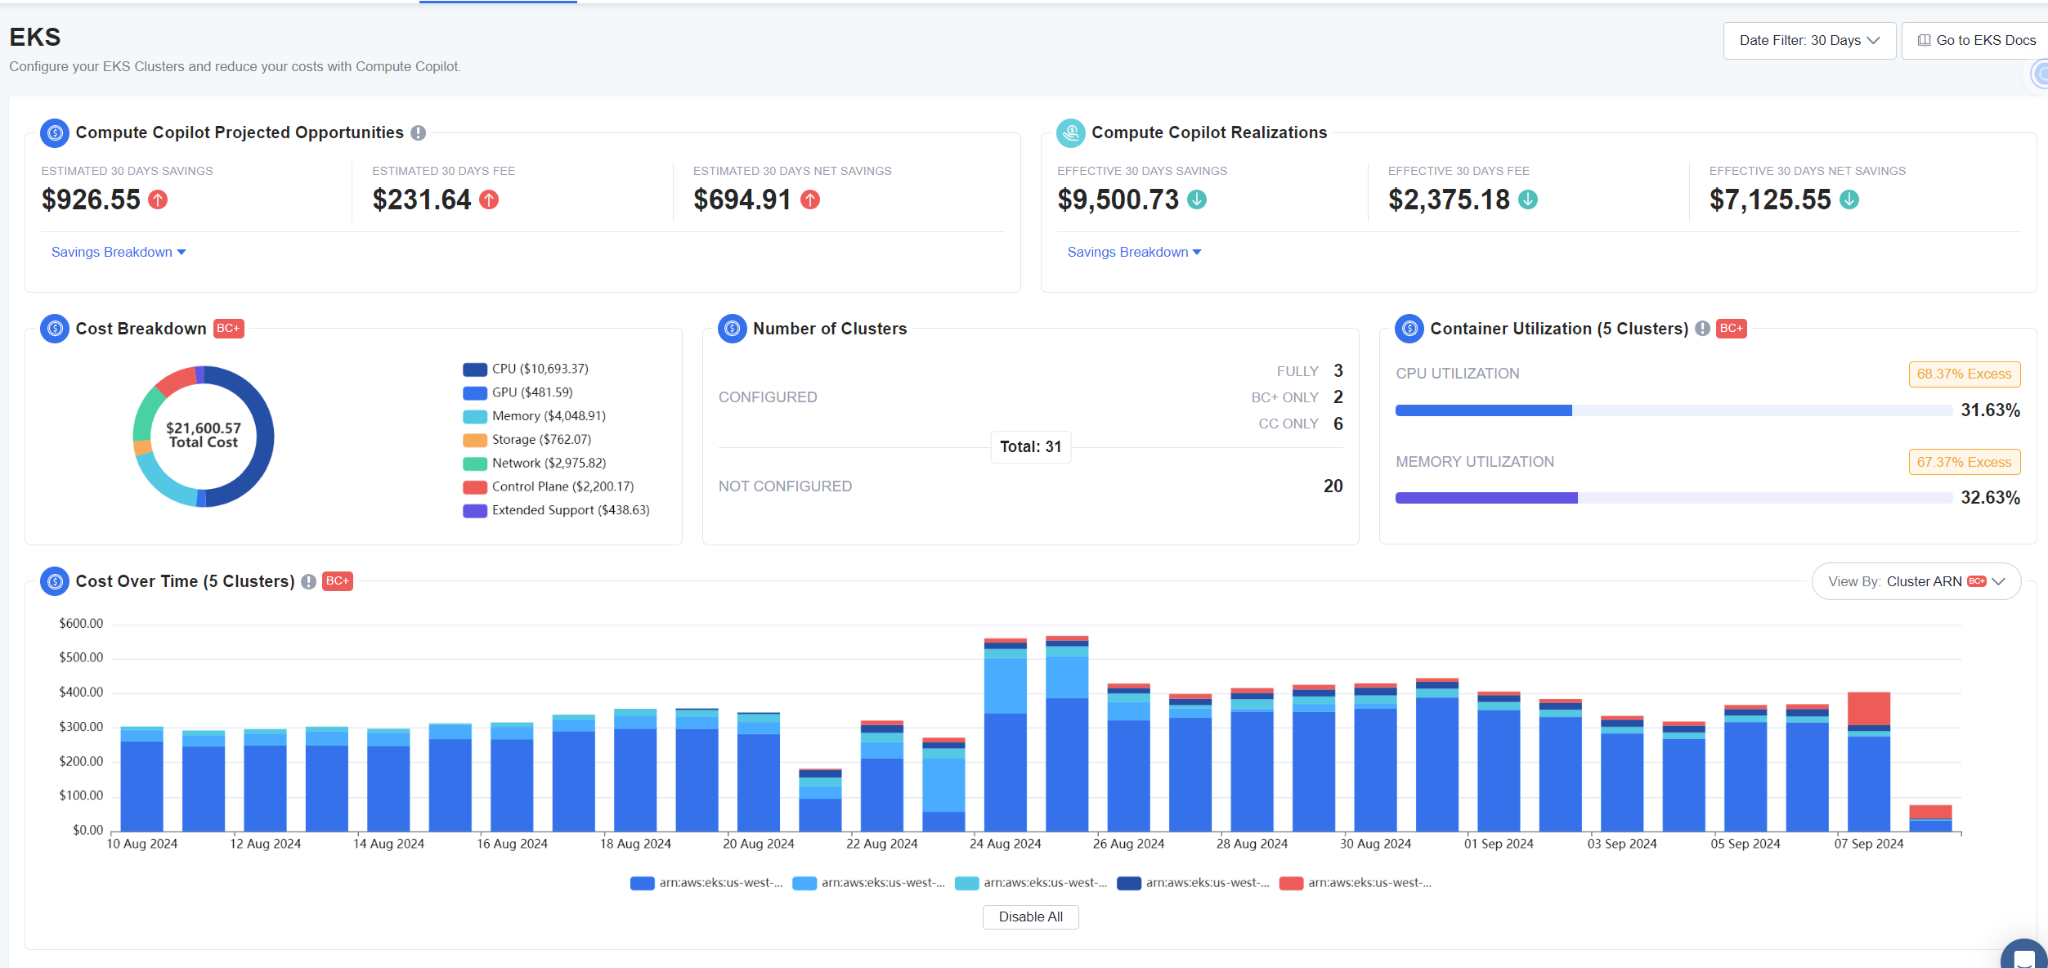
Track cost over time and actual savings
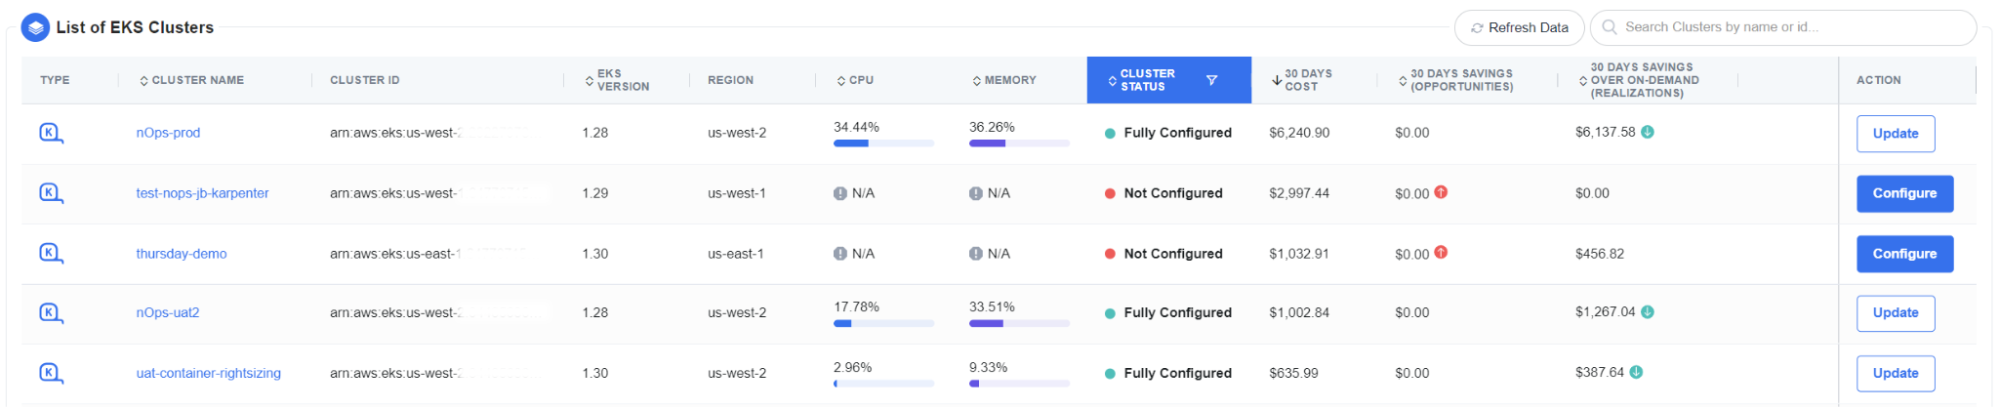
Configure clusters all in one place
Individual cluster efficiency dashboards
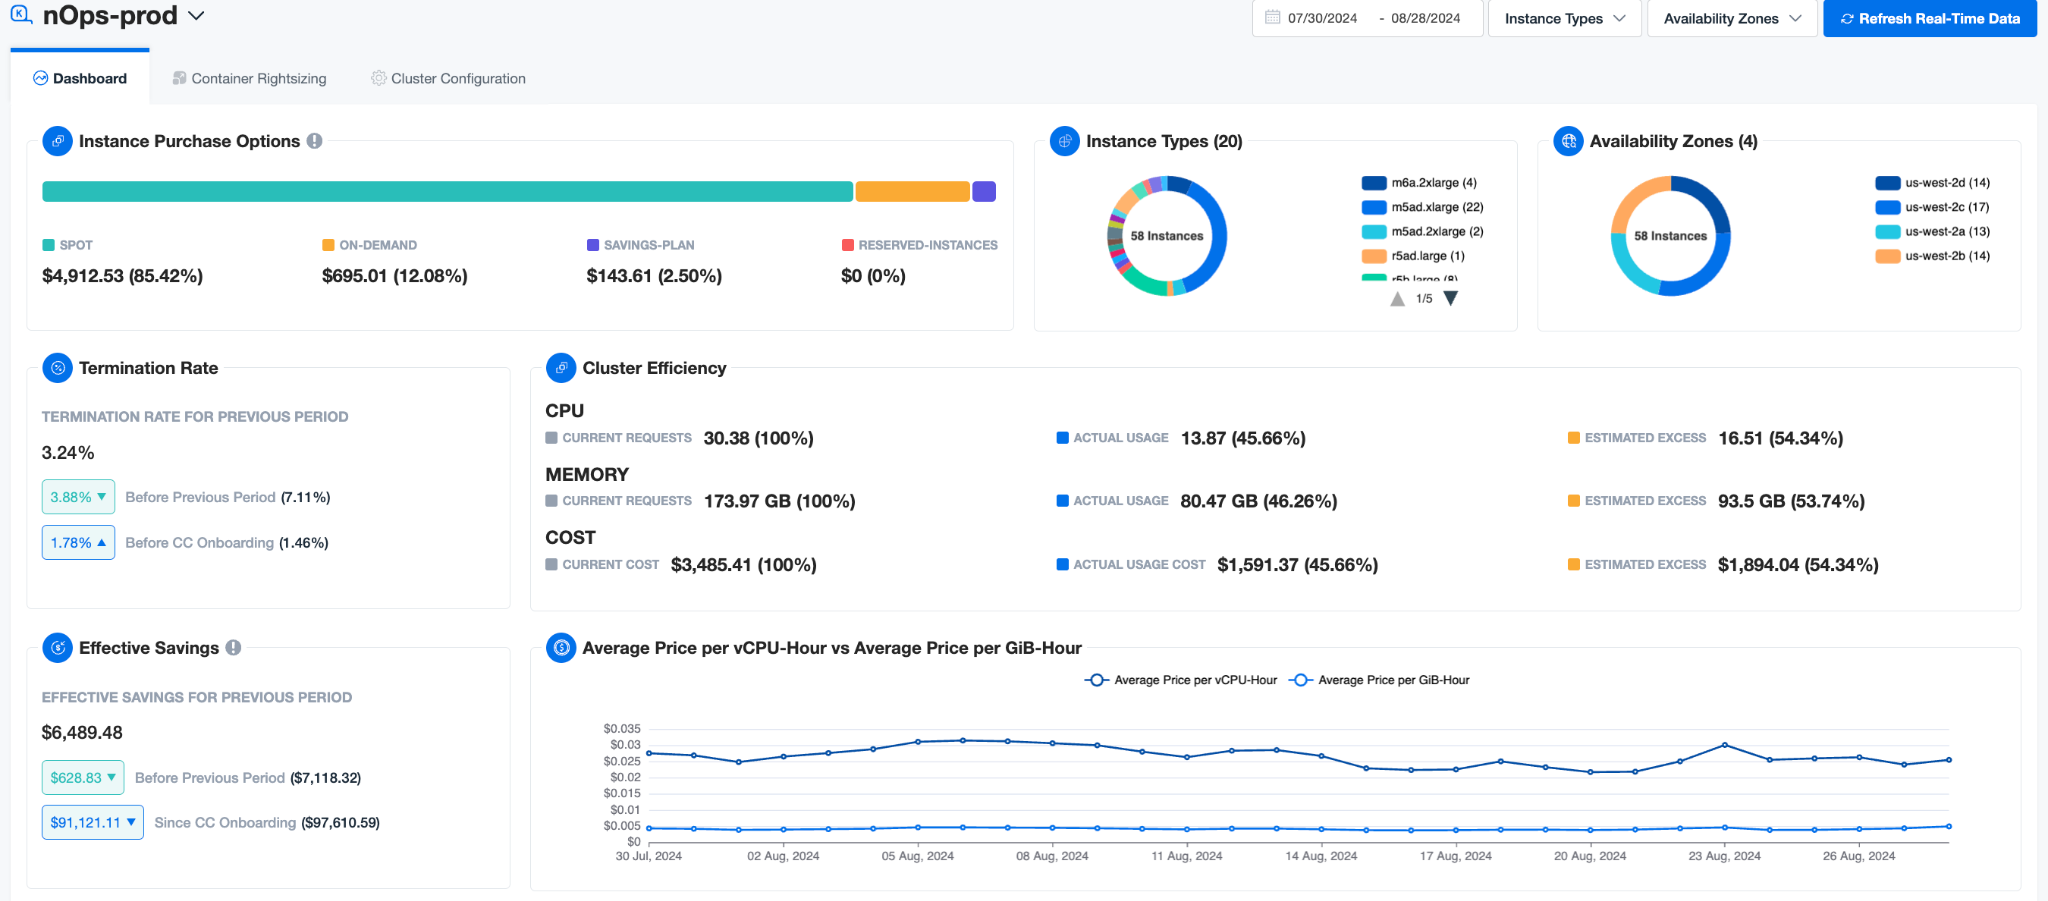
When you click on a cluster, you’ll see:
- Instance Purchase Options: View cost breakdowns by Spot, Savings Plans, Reserved Instances, and On-Demand usage.
- Spot Diversification: Displays distribution of Spot instance types across multiple availability zones for high reliability.
- Spot Termination: Shows the reduction in Spot instance termination rate since using Compute Copilot.
- Actual Savings: Tracks current and previous month’s savings, plus total savings since onboarding.
- Cost Efficiency: Compares price per vCPU hour vs. price per GB hour to see your cost optimization trends over time.
- Real-Time Workload Visualization: Monitors instance types, availability zones, and the split between Spot and On-Demand, including instances launched by AWS vs. those provisioned by Copilot.
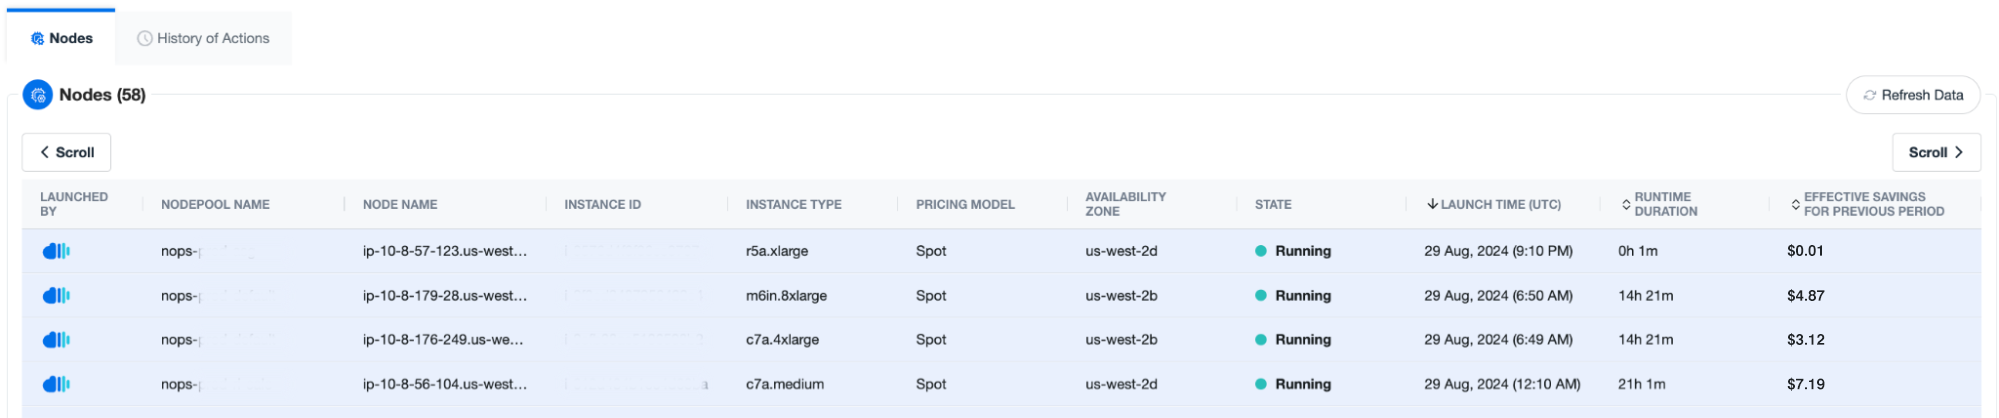
- Instance State & History or Actions: Provides real-time visibility of each instance’s type, pricing model, availability zone, launch time, runtime duration, and effective savings.
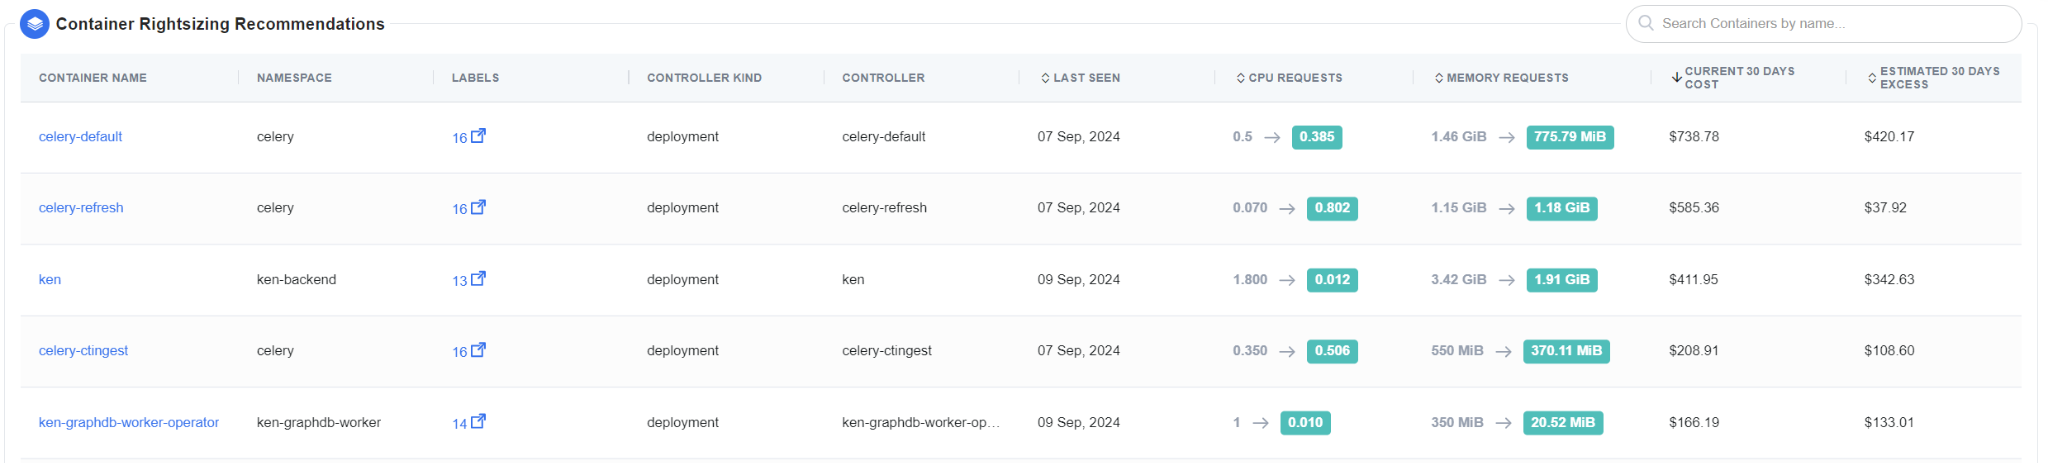
Container rightsizing recommendations
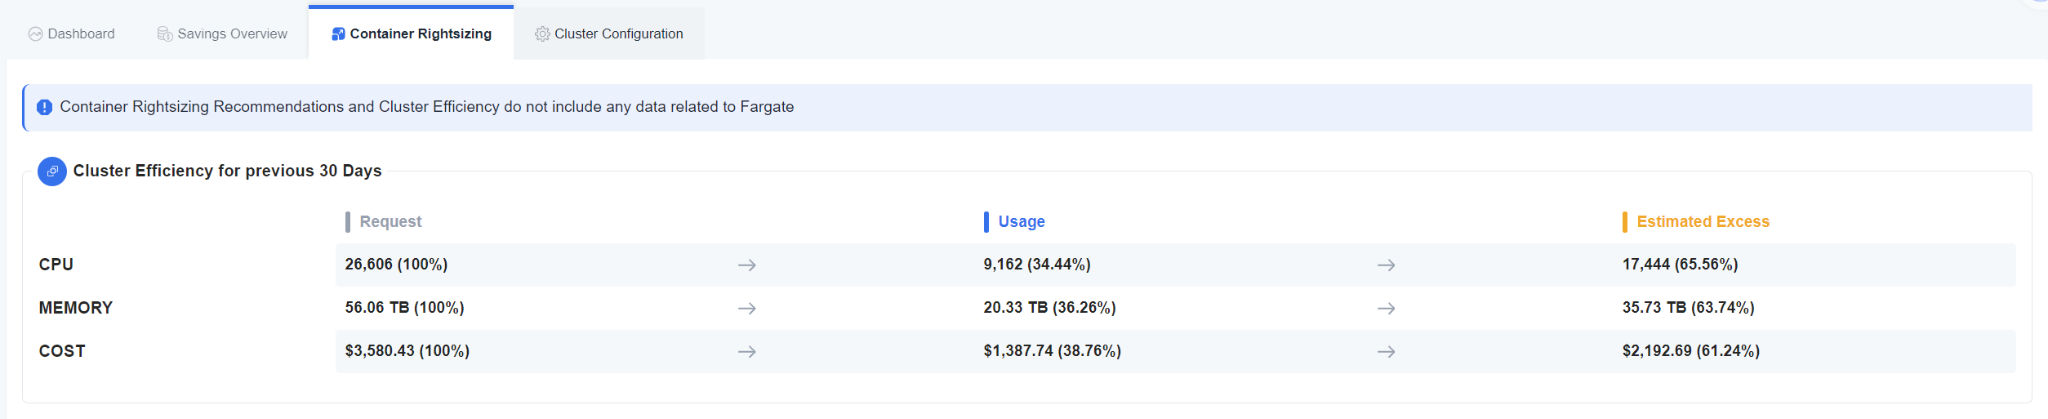
View your overall Cluster Efficiency for quick insights into overall performance: actual usage, current requests, cost and estimated waste.
nOps continually monitors a large span of your granular historical data for highly reliable container rightsizing recommendations. You can review the high-resolution historical data backing each recommendation in the dashboard.
How it works & how to get started
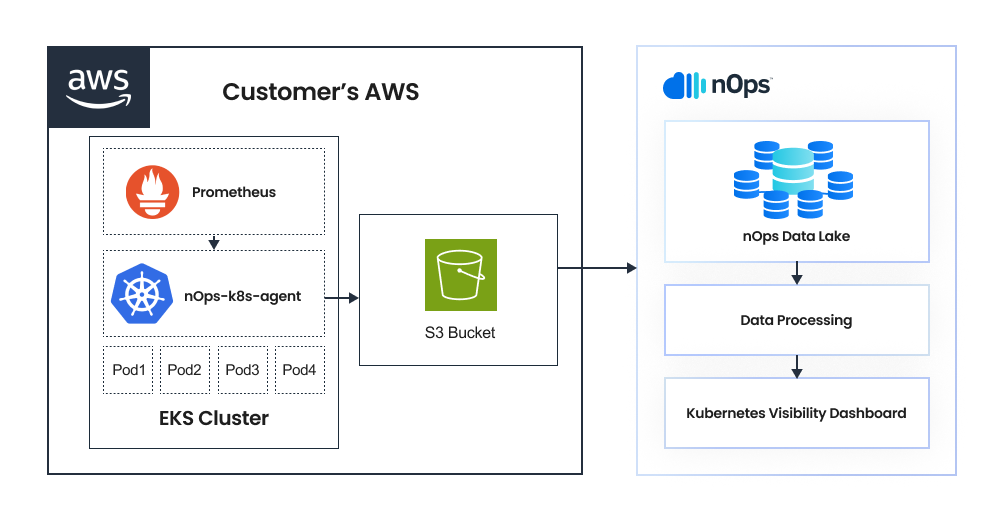
- You set up a lightweight k8s-agent that will work with Prometheus to collect and store data on your containers’ performance with a granularity that matches the CUR.
- The agent runs hourly, picking up metrics/metadata from the cluster stored in Prometheus on the previous hour.
- The agent exports the data into S3.
- The nOps recommendation engine processes your data to display in the dashboard.
If you’re already on nOps…
Have questions about the new dashboards? Need help getting started? Business Contexts+ customers can access this new feature directly from the nOps dashboard. If you’re not a Business Contexts+ customer, schedule a demo or reach out to your Customer Success Manager to learn more.
If you’re new to nOps…
nOps is a complete platform for Kubernetes optimization: allocate container costs, get visibility into 100% of your unified AWS spend, rightsize containers, run on Spot, manage your AWS commitments and more.
nOps was recently ranked #1 with five stars in G2’s cloud cost management category, and we optimize $1.5+ billion in cloud spend for our customers.
Join our customers using nOps to understand your cloud costs and leverage automation with complete confidence by booking a demo with one of our AWS experts.
Last Updated: May 17, 2025, Announcement
Last Updated: May 17, 2025, Announcement
