Skip to content
.png?width=1920&height=1080&name=Landscape%20(4).png)

Datadog has become the industry standard for observability. Engineers rely on it to monitor their infrastructure, troubleshoot issues, and build better systems—but while they’re focused on shipping the next feature or solving a production issue, Datadog costs are quietly stacking in the background.
Many teams start small but see expenses rise as log volumes grow, APM usage expands, and more custom metrics are introduced. Since pricing is complex — driven by multiple factors such as data ingestion, host count, and feature usage — engineers are often unaware of how pricing works and how quickly costs can add up
This guide covers tips, tricks, pitfalls and practical strategies to make the most of every dollar you spend on Datadog.
Why use Datadog?
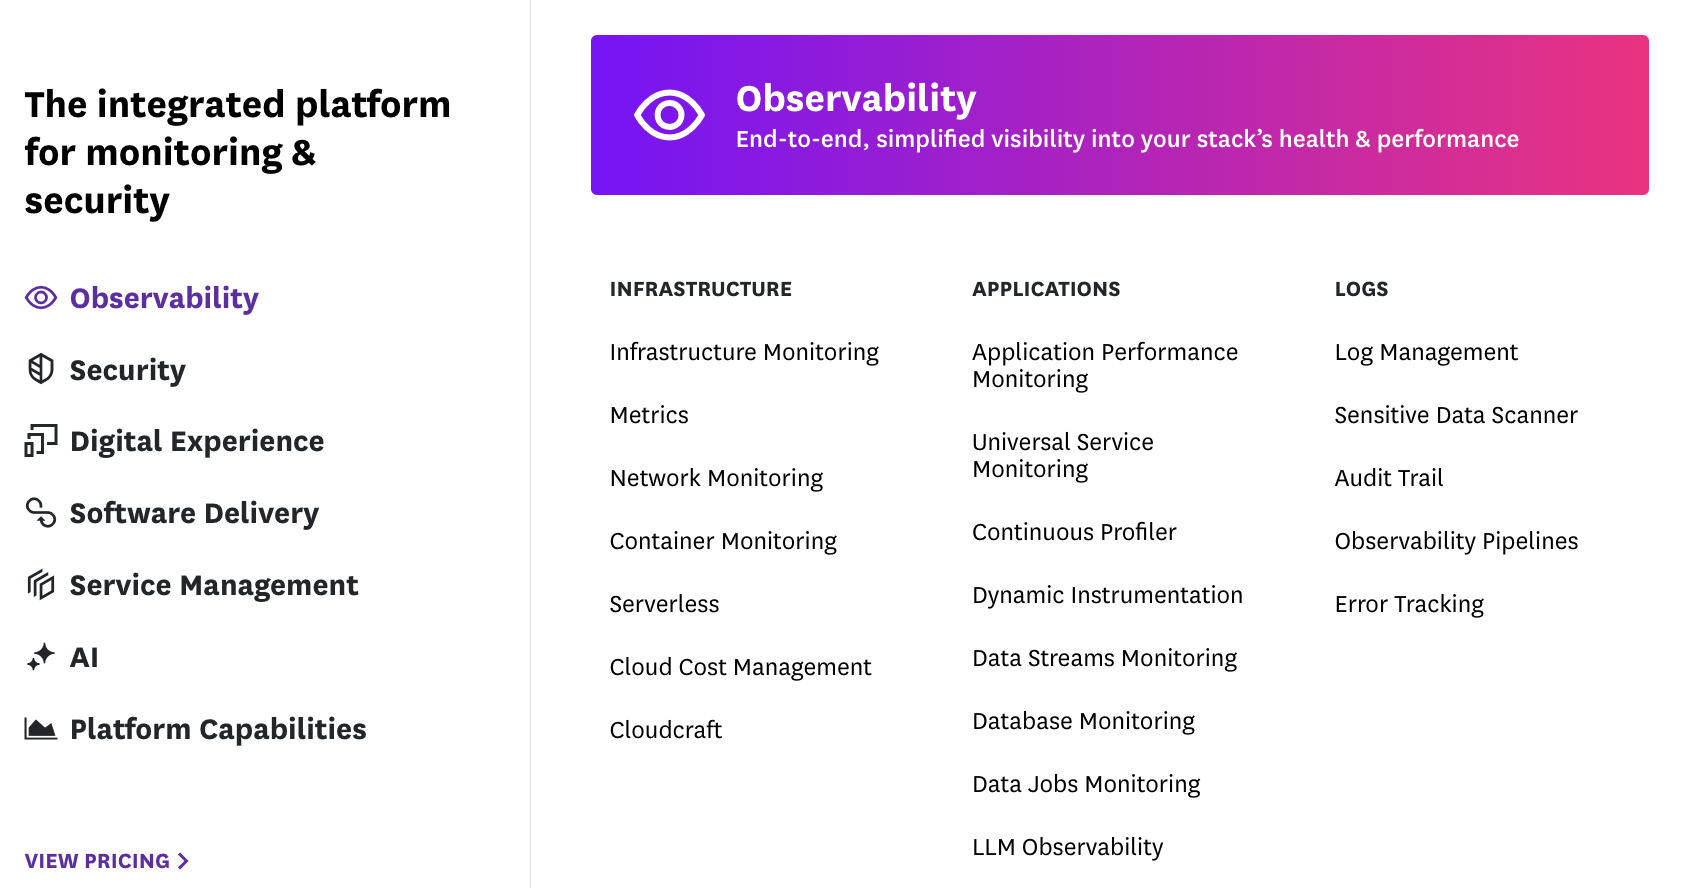
Datadog is a cloud-based monitoring and observability platform that tracks infrastructure, applications, logs, and security data in real time. It provides deep visibility into system performance with metrics, traces, and logs, helping engineers detect and troubleshoot issues faster. With support for over 850 integrations, Datadog collects and correlates data across cloud environments, Kubernetes clusters, and on-prem systems.
How to Optimize Datadog Costs
The primary driver behind soaring Datadog costs tends to be the sheer volume of observability data— including metrics, events, logs, traces, etc. As monitoring expands, data ingestion can grow exponentially, often leading to unexpected spikes in billing.
Let’s talk about some practical strategies to rein in Datadog expenses while maintaining visibility.
#1: Understand the Pricing Model
Review your Datadog’s pricing model to identify key cost contributors. For example, you might want to pay particular attention to:
- APM: Billed per host—costs rise as you deploy more instrumented services, even if they generate minimal traces.
- Logs: Charged per GB ingested and retained—verbose application logs, debug-level logging in production, and unnecessary retention can drive up costs fast.
- Custom Metrics: Priced based on unique metric-count per hour—high-cardinality tags (e.g., per-user metrics) can cause exponential growth.
- RUM & Synthetic Monitoring: Billed per session or test—frequent synthetic tests and large user bases can make costs scale unpredictably.
Check the table below for a summary of costly Datadog services and how they are billed.
| Service | Pricing | Key Cost Factor |
| Infrastructure Monitoring | $15 per host/month (annual) | $23 per host/month (Enterprise) | Billed per host |
| Application Performance Monitoring (APM) | $31 per host/month | Billed per host |
| Log Management | $0.10 per GB ingested (uncompressed) | Billed per GB ingested and retention period |
| Custom Metrics | Usage-based, calculated by average hourly distinct custom metrics | Billed based on distinct custom metrics |
| Real User Monitoring (RUM) | $1.50 per 1,000 sessions/month | Billed per 1,000 user sessions |
| Synthetic Monitoring (API Tests) | $5 per 10,000 test runs/month | Billed per 10,000 API test runs |
| Synthetic Monitoring (Browser Tests) | $12 per 1,000 test runs/month | Billed per 1,000 browser test runs |
To keep costs under control, monitor usage trends and set alerts for unexpected spikes in logs, hosts, or APM consumption. Datadog’s pricing model means costs can creep up as new features are enabled, more services are instrumented, or retention policies go unchecked.
Regularly analyzing monthly invoices can help pinpoint where spending is increasing unnecessarily, whether it’s excessive logging, underutilized APM, or high-cardinality custom metrics.
#2: Reduce Log Ingestion
Log costs in Datadog can spiral out of control quickly since they’re billed per GB ingested and retained. Many teams unintentionally enable logs for applications or services, or collect far more logs than they actually need—debug logs in production, duplicate messages, and redundant event data all add up. Here’s how to minimize unnecessary log costs:
Apply Log Retention Filters: Not every log needs to be stored indefinitely. Use Datadog’s retention filters to automatically drop low-value logs like heartbeats, periodic status updates, or verbose debug messages before they’re indexed.
Use Exclusion Filters for Dev/Test Logs: Logs from development and testing environments often don’t need full retention in Datadog. Apply exclusion filters to stop ingesting non-essential logs that don’t contribute to production monitoring.
Implement Log Sampling: Instead of storing every single log event, sample logs based on predefined rules. For high-volume services, keeping just a fraction of logs can provide sufficient insights while cutting ingestion costs dramatically.
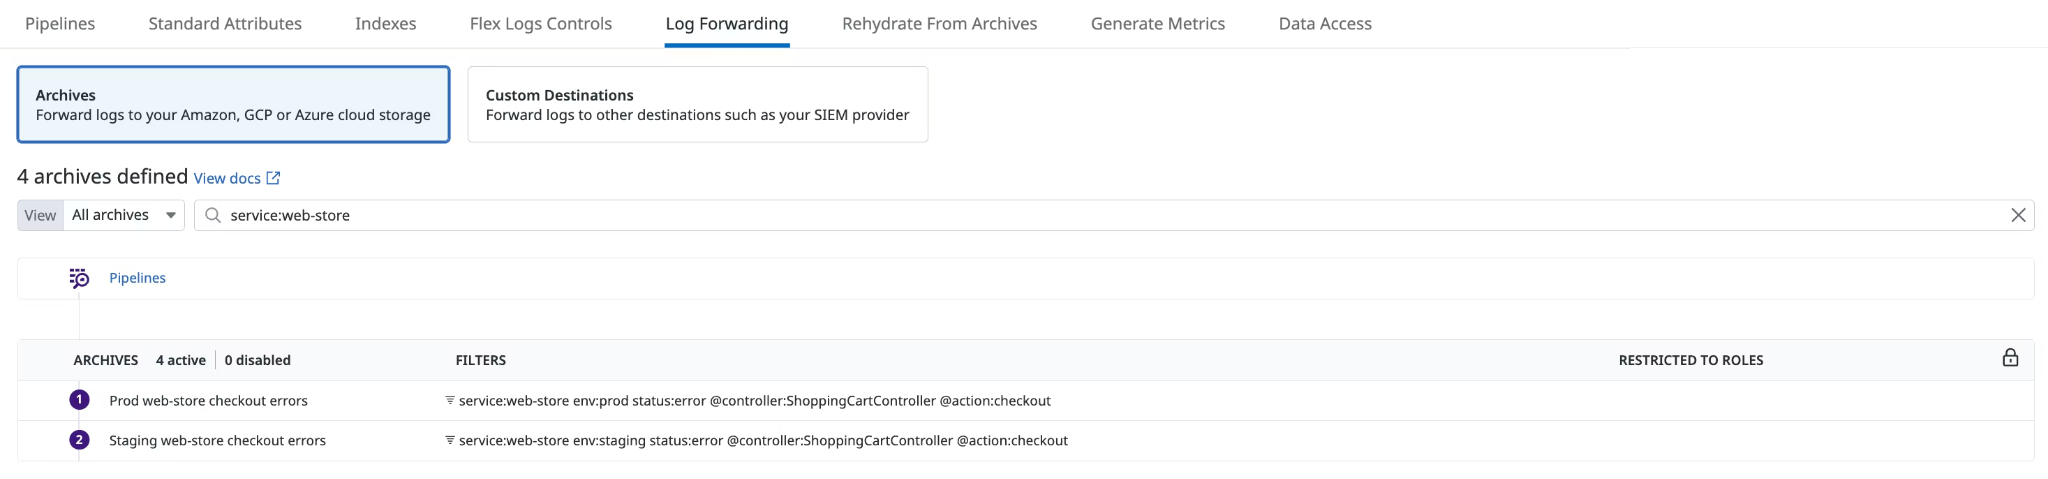
Shift Logs to Cheaper Storage: Not all logs need real-time analysis. Move older or less critical logs to cheaper storage options like Amazon S3 or OpenSearch, using Datadog’s Log Archives to keep them accessible without the high indexing costs.
#3: Optimize Custom Metrics
Custom metrics can be a stealthy cost driver in Datadog. They’re priced based on the number of unique metric series stored per hour, meaning high-cardinality metrics—those with excessive tags, labels, or unique identifiers—can cause costs to explode without delivering proportional value.
Here are some strategies for reining them in:
Reduce High-Cardinality Tags: Every tag combination creates a distinct metric series, meaning tracking something like CPU usage per pod, per region, per availability zone can generate thousands of unique metrics. Instead, only tag dimensions that are essential for troubleshooting—for example, tracking per-region latency instead of per-user latency can cut down on unneeded metric series.
Consolidate Redundant Metrics & Cap Metrics Per Service: It’s common for teams to track the same metric across different sources (e.g., infrastructure monitoring and APM both tracking request latency). Cross-check metric definitions to avoid duplicates and remove any redundant data streams.
Some teams unknowingly let every microservice define its own custom metrics, which leads to massive metric inflation. Set clear guidelines—do you really need every service reporting its own request count, or can you track it at the load balancer level?
Audit and Remove Unused Metrics: Datadog doesn’t automatically delete old custom metrics, meaning you could be paying for data that no one looks at anymore. Use Datadog’s Metric Summary page to find and eliminate custom metrics that haven’t been queried recently.
#4: Use Consumption-based Pricing for Ephemeral Workloads
One of the biggest cost pitfalls with Datadog comes from teams optimizing their infrastructure—only to see monitoring costs unexpectedly spike. Optimizing workload efficiency—such as increasing Spot usage or improving instance utilization—can actually eat up your savings by spiking Datadog costs. For example, If you move from a single 8xlarge instance to eight xlarge instances, your Datadog host count increases by eight, driving up costs even though overall resource utilization has improved.
To mitigate this, consider Datadog’s consumption-based pricing models. Datadog’s default per-host pricing model can be inefficient for highly dynamic environments. To avoid this, consider alternative pricing options like Container Monitoring or Serverless Monitoring, which charge based on usage (e.g., per-container, per-pod, or per-invocation) rather than per-host. These models are better suited for workloads with high churn, frequent autoscaling, or Spot-based architectures.
By leveraging these pricing options, teams can avoid paying a fixed per-host fee for infrastructure that exists only briefly, ensuring that increased Spot usage or workload tuning doesn’t lead to unintended monitoring cost spikes.
#5: Use Committed Use Discounts
Datadog’s annual and multi-year discounts can cut costs, but only if your usage is stable and predictable. Committing too soon—before tracking real usage patterns—can lock you into overpaying for capacity you don’t actually need. Instead of committing across the board, focus on services with steady consumption, like infrastructure monitoring, while keeping high-variance costs like log ingestion on a pay-as-you-go plan.
| Service | Commit? | Why? |
| Infrastructure Monitoring | ✅ | Host count remains stable, making it a predictable cost. |
| APM (Application Performance Monitoring) | ✅ | Core services typically require continuous monitoring. Commit to a baseline host count. |
| Security Monitoring & Cloud SIEM | ✅ | Security tools are always-on, making them reliable for commitments. |
| Database Monitoring | ✅ | Monitoring databases is a long-term need and usually scales predictably. |
| Log Management | ❌ | Log volume fluctuates with debugging, traffic spikes, and feature rollouts—making commitments risky. |
| Custom Metrics | ❌ | High-cardinality metrics can grow unpredictably as tagging strategies evolve. |
| Real User Monitoring (RUM) | ❌ | User sessions fluctuate, making commitments difficult to predict. |
| Synthetic Monitoring (API & Browser Tests) | ❌ | Test frequency may change, leading to unused commitments or expensive overages. |
| Cloud Cost Management (if applicable) | ❌ | Cloud costs fluctuate based on deployments, so committing may not align with actual needs. |
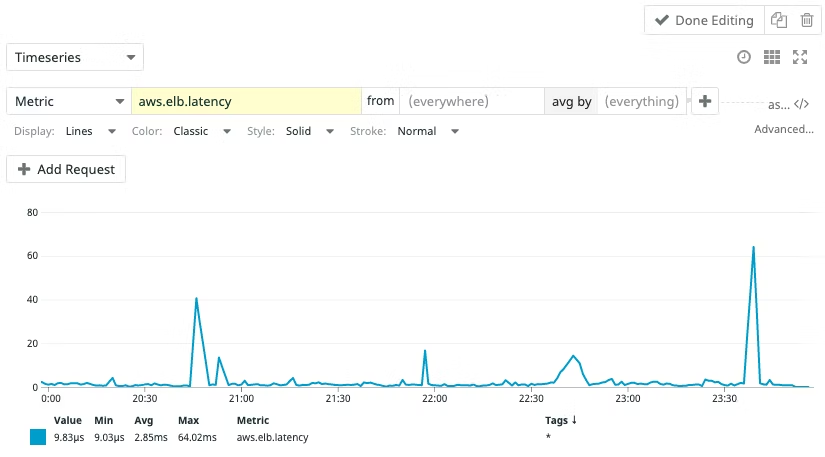
#6: Leverage Metric Aggregation
Pre-aggregate at the Source
If you’re monitoring high-volume services like Kubernetes, instead of pushing every CPU or memory sample from each container, pre-aggregate those metrics at the node level before forwarding them to Datadog. This reduces redundant data while maintaining useful insights. Tools like Prometheus and OpenTelemetry can help handle local aggregation before sending data upstream.
Use Rollups Instead of Raw Data
Datadog provides built-in rollups to reduce the granularity of historical metrics. Instead of retaining per-second data indefinitely, configure rollups to store only the most critical summaries over longer retention periods (e.g., per-minute or per-hour averages for old data). This dramatically reduces storage costs while preserving long-term trends.
More strategies to lower Datadog AND overall cloud costs
Optimizing Datadog costs goes hand in hand with reducing overall cloud waste—by eliminating inefficiencies across infrastructure, you can cut monitoring expenses while lowering your entire cloud bill.
These next strategies will help significantly reduce your overall costs:
#7: Implement Scheduling
Implementing resource scheduling helps align monitoring activities with actual usage patterns. By automating the shutdown of non-production workloads during weekends and off-hours, you can significantly reduce unnecessary data ingestion and associated monitoring expenses. Tools like nOps can detect and pause idle cloud resources automatically, ensuring that you’re not incurring costs for unused capacity.
Additionally, dynamically scheduling Datadog agent collection intervals to reduce monitoring during low-usage periods can further optimize costs. This proactive management of resource utilization not only lowers Datadog expenses but also contributes to overall cloud cost efficiency.
#8: Consolidate Workloads Onto Fewer Instances or Containers
Consolidating workloads can lead to significant reductions in Datadog costs. Instead of merely combining underutilized services, it’s essential to analyze the performance profiles and resource consumption patterns of your applications. By identifying services with complementary usage patterns, you can co-locate them on the same host or container, thereby maximizing resource utilization without compromising performance.
This approach reduces the number of active hosts and containers, directly decreasing Datadog’s per-host monitoring expenses.
Additionally, implementing container orchestration tools like Kubernetes allows for dynamic scaling and efficient resource allocation, ensuring that you’re only consuming—and paying for—the necessary resources at any given time. Regularly reviewing and adjusting resource limits and requests for your containers can prevent over-provisioning and further optimize both infrastructure and monitoring costs.
#9: Optimize Kubernetes (EKS) Deployments
Adjust pod density to maximize node utilization and reduce monitoring overhead.
Many Kubernetes clusters run with suboptimal pod density, leaving expensive resources underutilized while still incurring Datadog monitoring costs per node. Instead of letting Kubernetes’ default scheduler spread pods evenly across nodes, use bin packing strategies—adjust CPU/memory requests and limits to ensure nodes are efficiently packed before spinning up additional ones. Consider using the Pod Topology Spread Constraints to prevent unnecessary node scaling. A well-optimized cluster with fewer, fully utilized nodes reduces Datadog costs by minimizing per-node monitoring fees.
Use autoscalers like Karpenter to provision only the necessary instances in real-time.
Traditional Cluster Autoscaler-based scaling policies often lag behind workload demands or keep nodes running longer than necessary, leading to unnecessary monitoring costs. Karpenter dynamically provisions only the required instances when workloads spike, then rapidly removes them when they’re no longer needed. This prevents lingering nodes from accumulating costs in Datadog’s per-host pricing model. By integrating Karpenter with Spot Instances, you can further reduce cloud costs while ensuring Datadog isn’t monitoring excess infrastructure.
Limit metric collection on non-critical namespaces, workloads, or services.
Datadog captures every possible metric by default, but many teams don’t need visibility into every pod, namespace, or application detail. Disable metrics for non-critical workloads, like CI/CD jobs, cron jobs, and ephemeral workloads that don’t require long-term monitoring. You can achieve this by setting Datadog Autodiscovery exclusion rules to filter out unnecessary metrics, logs, and traces. This reduces ingestion costs while keeping your dashboards focused on actionable insights.
Understand and optimize your Datadog costs with nOps
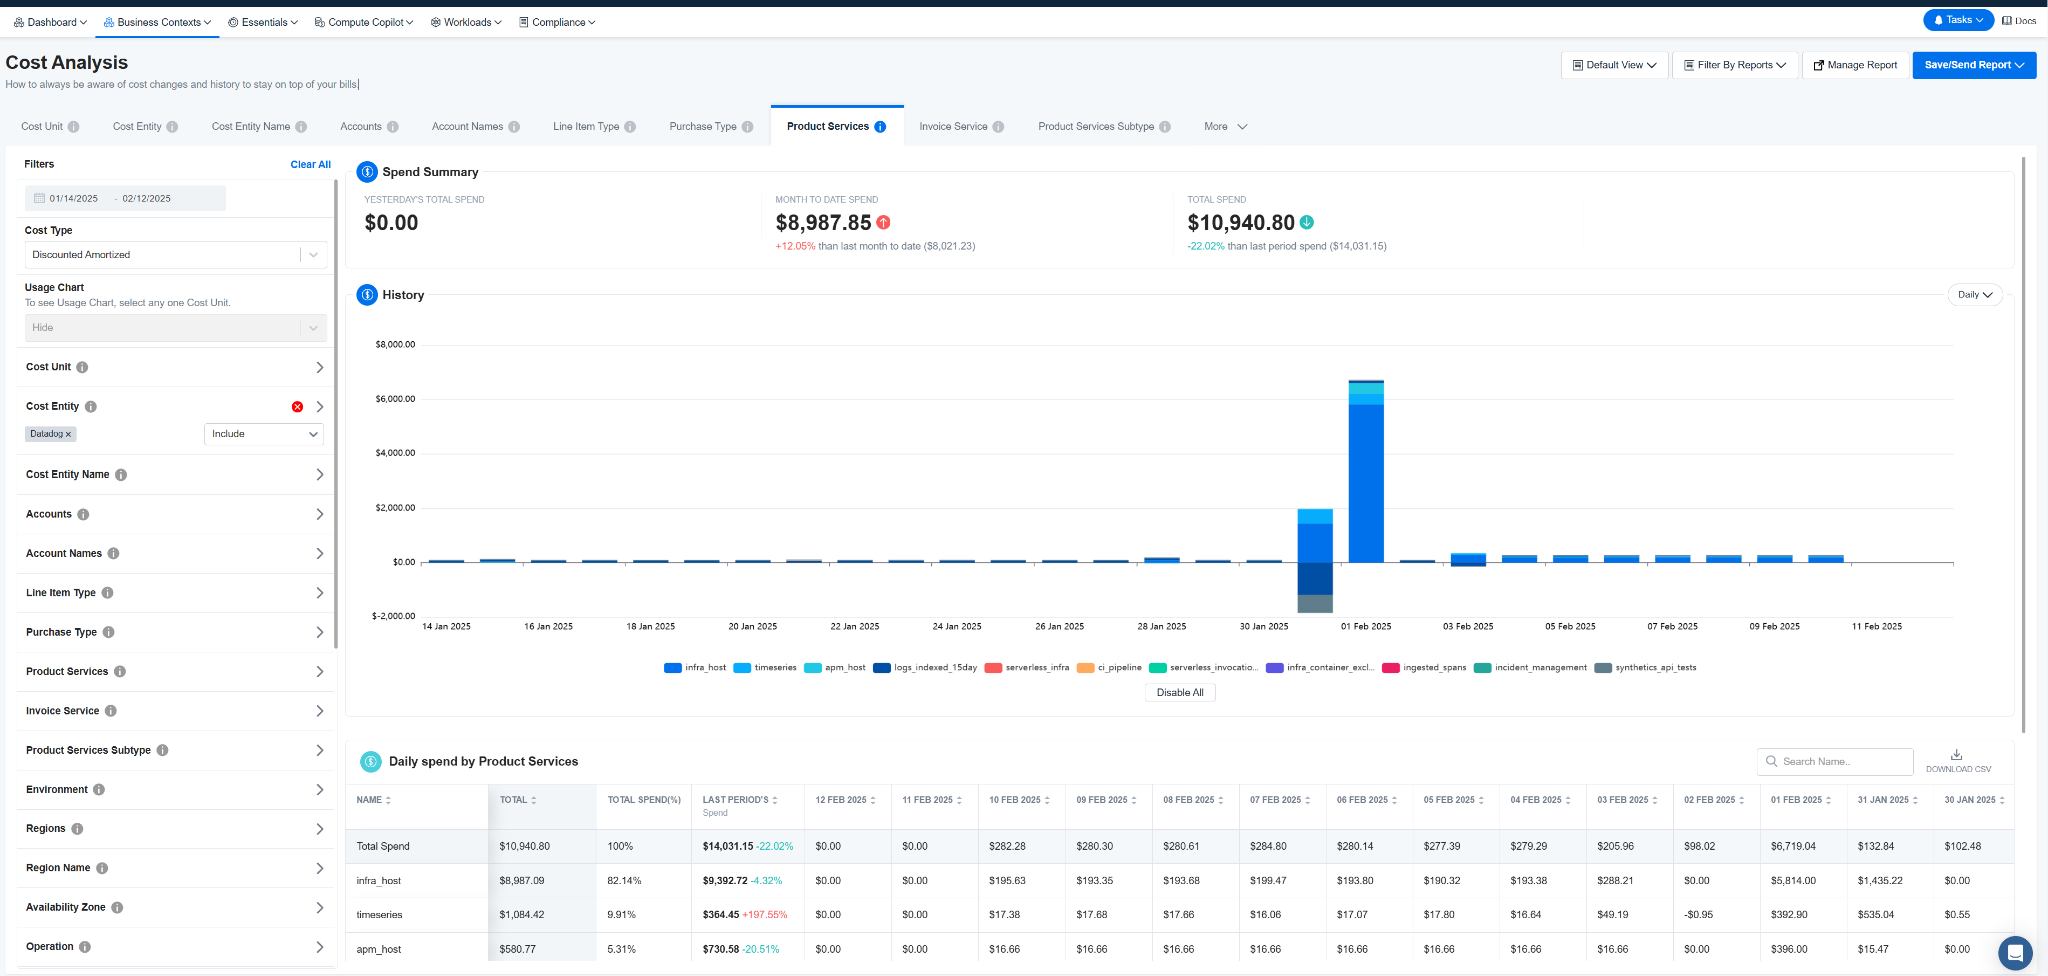
Understand and see where and what you are paying to Datadog with nOps Business Contexts+.
Datadog invoices can be difficult to break down and visualize due to the granular usage-based pricing and complexity of custom metrics and logs, often obscuring the real drivers of cost.
Instead of manually parsing bills, use nOps Business Contexts+, which ingests Datadog billing data alongside your cloud costs, providing a unified view of monitoring expenses by service, team, or environment.
This makes it easy to see which workloads are generating unnecessary Datadog charges—whether it’s excessive log ingestion, overmonitored test environments, or redundant APM coverage.
Automate rightsizing and scaling decisions to reduce unnecessary monitoring costs.
Datadog costs don’t just come from the platform itself—they’re deeply tied to how infrastructure is provisioned. nOps integrates with Datadog to provide real-time automated rightsizing for EC2, ASGs, and Kubernetes workloads, ensuring you aren’t monitoring oversized or underutilized resources.
By automatically scaling down over-provisioned instances, you reduce per-host Datadog charges without sacrificing performance.
Cloud waste cleanup can also help you reduce both Datadog and cloud costs at the same time.
Datadog monitors every running resource, even if it’s idle, meaning that wasteful infrastructure drives up both cloud and observability costs.
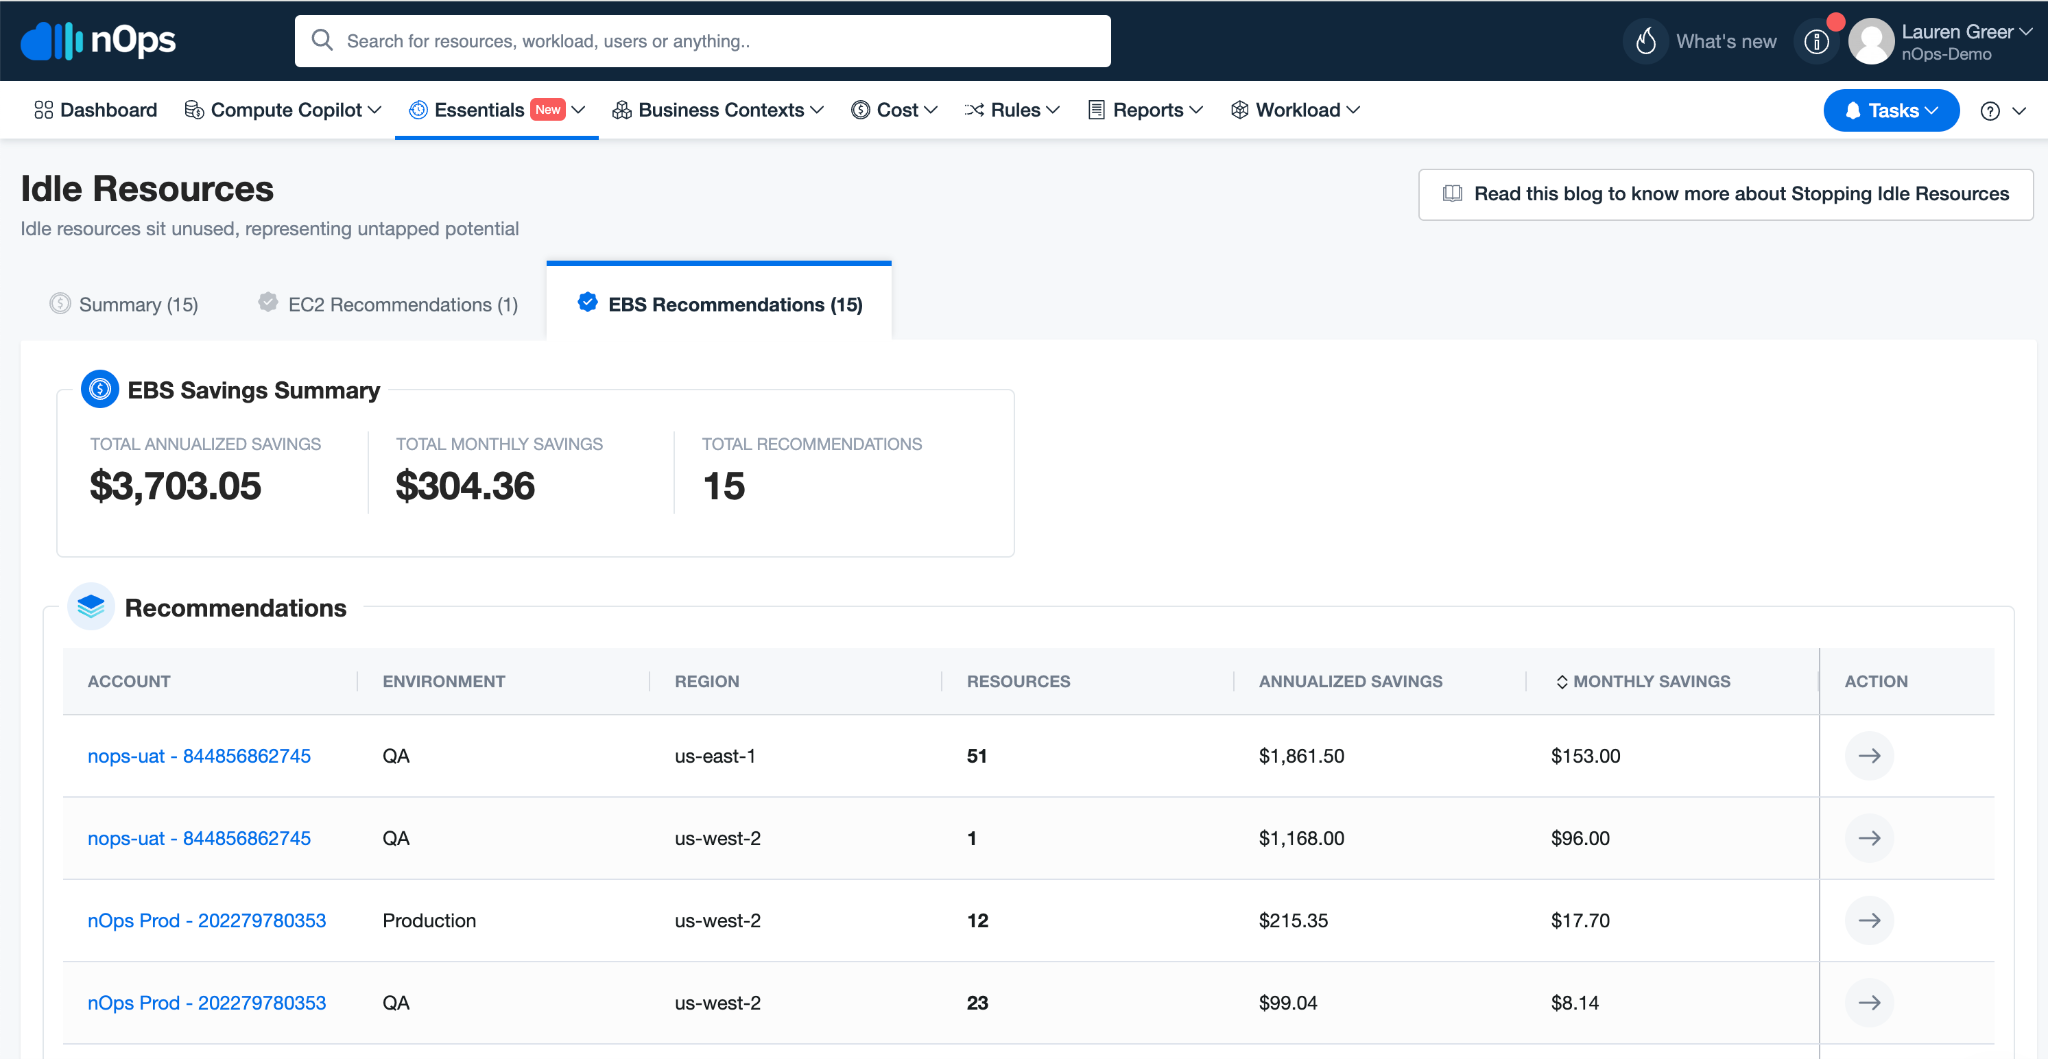
nOps detects and deactivates unused EC2 instances, EBS volumes and other resources, preventing unnecessary Datadog monitoring fees. A simple way to start is by cleaning up long-running, forgotten instances—especially in dev/test environments. By integrating nOps Essentials with Datadog, you can ensure that costly, idle resources aren’t silently eating into your monitoring budget.
How to get started with nOps
nOps was recently ranked #1 with five stars in G2’s cloud cost management category, and we optimize $2+ billion in cloud spend for our customers.
Join our customers using nOps to understand your Databricks costs and leverage automation with complete confidence by booking a demo with one of our AWS experts.