Databricks Workload Optimization Part 1: Visibility, Tags, Cost Allocation, Budgeting

nOps is an automated cloud optimization platform that uses machine learning algorithms and automation to optimize costs. We manage $2 billion in cloud spending for our customers, continually processing huge amounts of data using Databricks.

Based on our recent webinar Databricks Workload Optimization, this article takes you through the best practices and strategies we’ve learned while building and operating our next-generation data platform.

Download the full webinar here, or read on to find out how to get more out of every dollar you spend on Databricks.

Databricks Workload Optimization: Best Practices for Visibility, Performance and Savings

In this blog series, we’ll cover a framework for optimizing your Databricks workloads:

  • Part 1: Visibility: Tags, Cost Allocation, R&D and Budgeting
  • Part 2: Databricks Rate Optimization Best Practices
  • Part 3: AWS Rate Optimization for Databricks Workloads
  • Part 4: Databricks Workload Optimization
  • Part 5: AWS Resource Efficiency for Databricks Workloads
  • Part 6: Autoscaling Tuning

Why we use Databricks at nOps 

If you’ve been working in tech, you’ve likely observed a shift over the last ten years. It used to be that we did a lot of the data processing and heavy lifting in the API and backend layer. But with streaming, near real-time analytics, AI and other advanced use cases, every problem is becoming a data problem. 

When we were building out the nOps platform around 3 years ago, we were looking for a scalable data solution that would allow our engineers to focus on building and innovating rather than on operating the tools we needed. We started to experiment with Databricks, and the benefits in terms of scalability, performance and reliability were just the beginning. What began as a set of tools became a platform entirely built on Databricks.

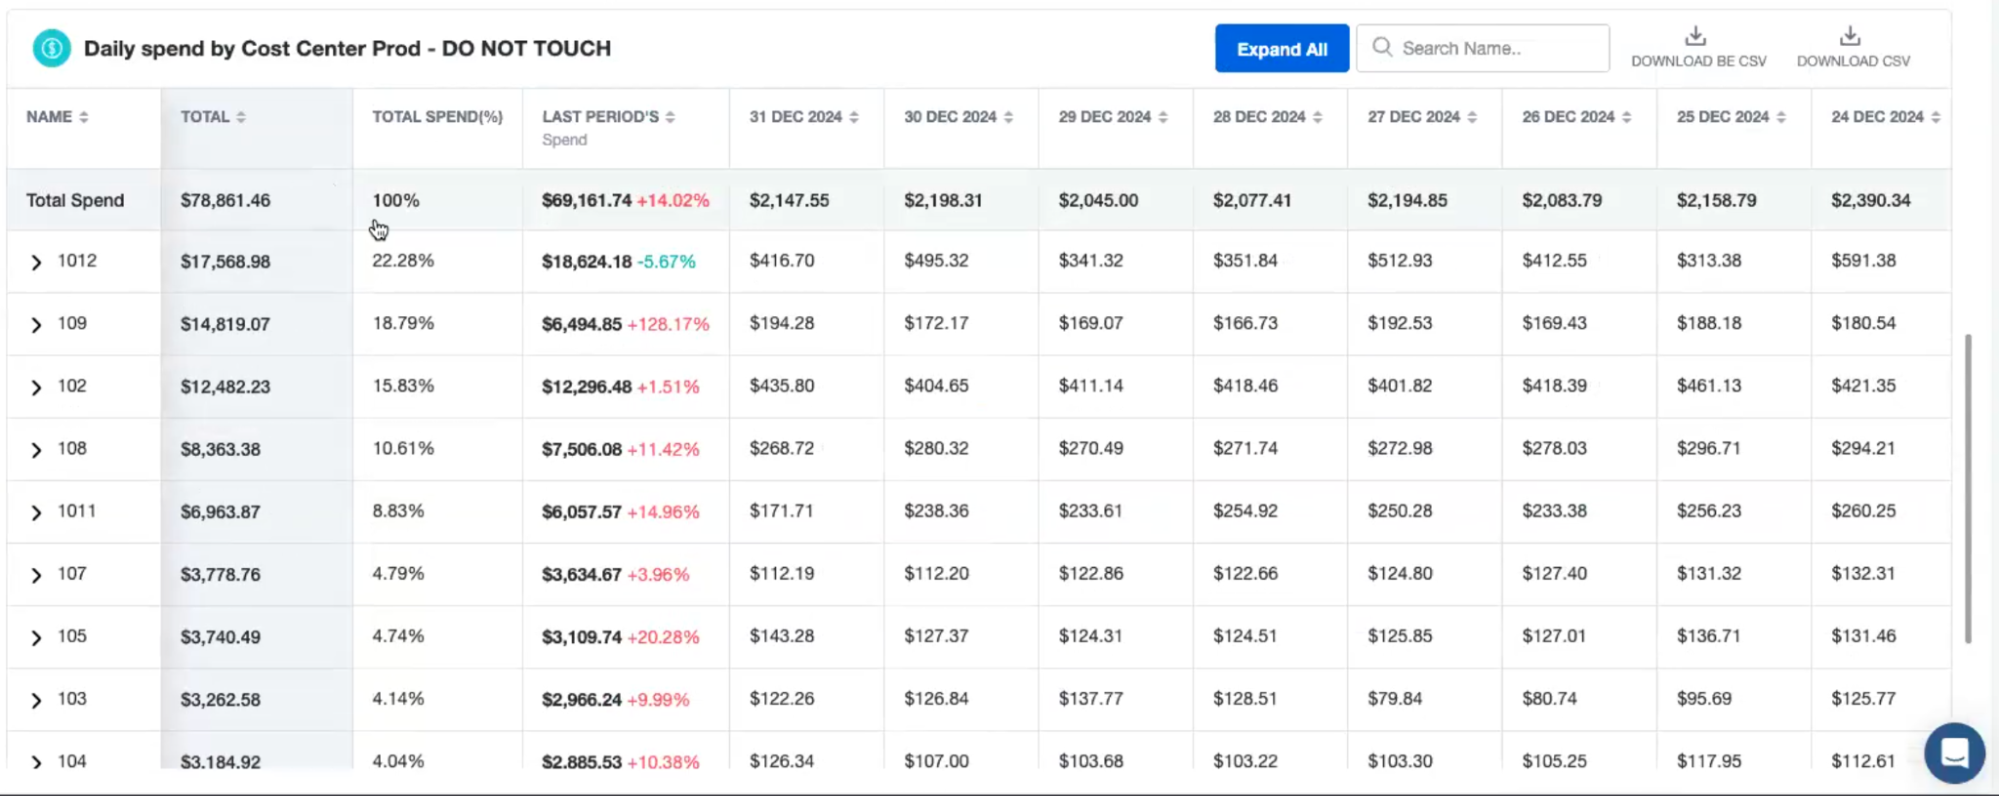
Today, we ingest all our data using Databricks workload orchestration, leveraging workload flows and task features. We run all our Spark and data transformation workloads on Databricks, preparing data to drive recommendations and real-time automation that give our customers insight into their public cloud spend and the ability to take action to cut costs. For us, Databricks has been essential to moving fast and delivering on innovation.

Data diagram

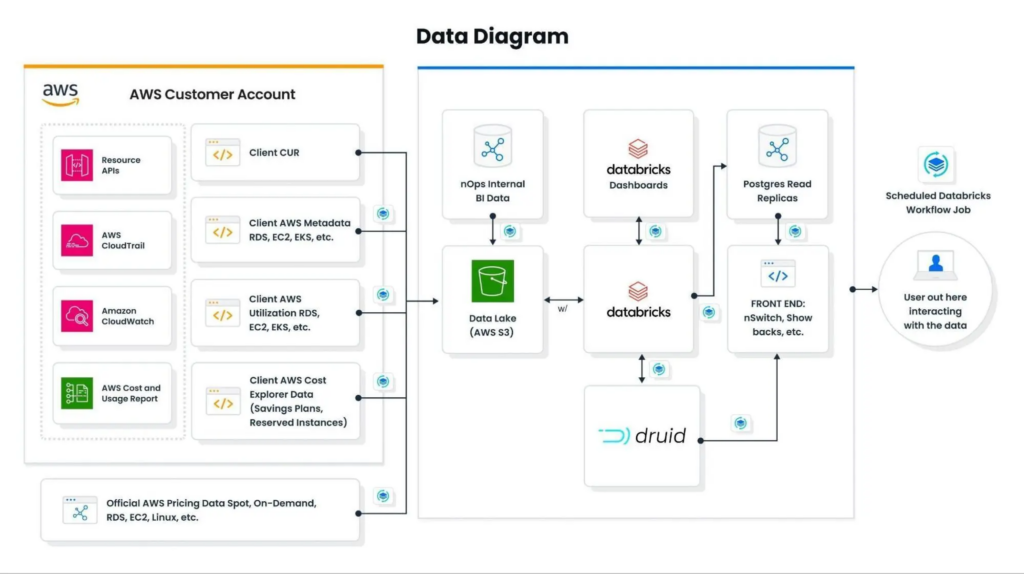
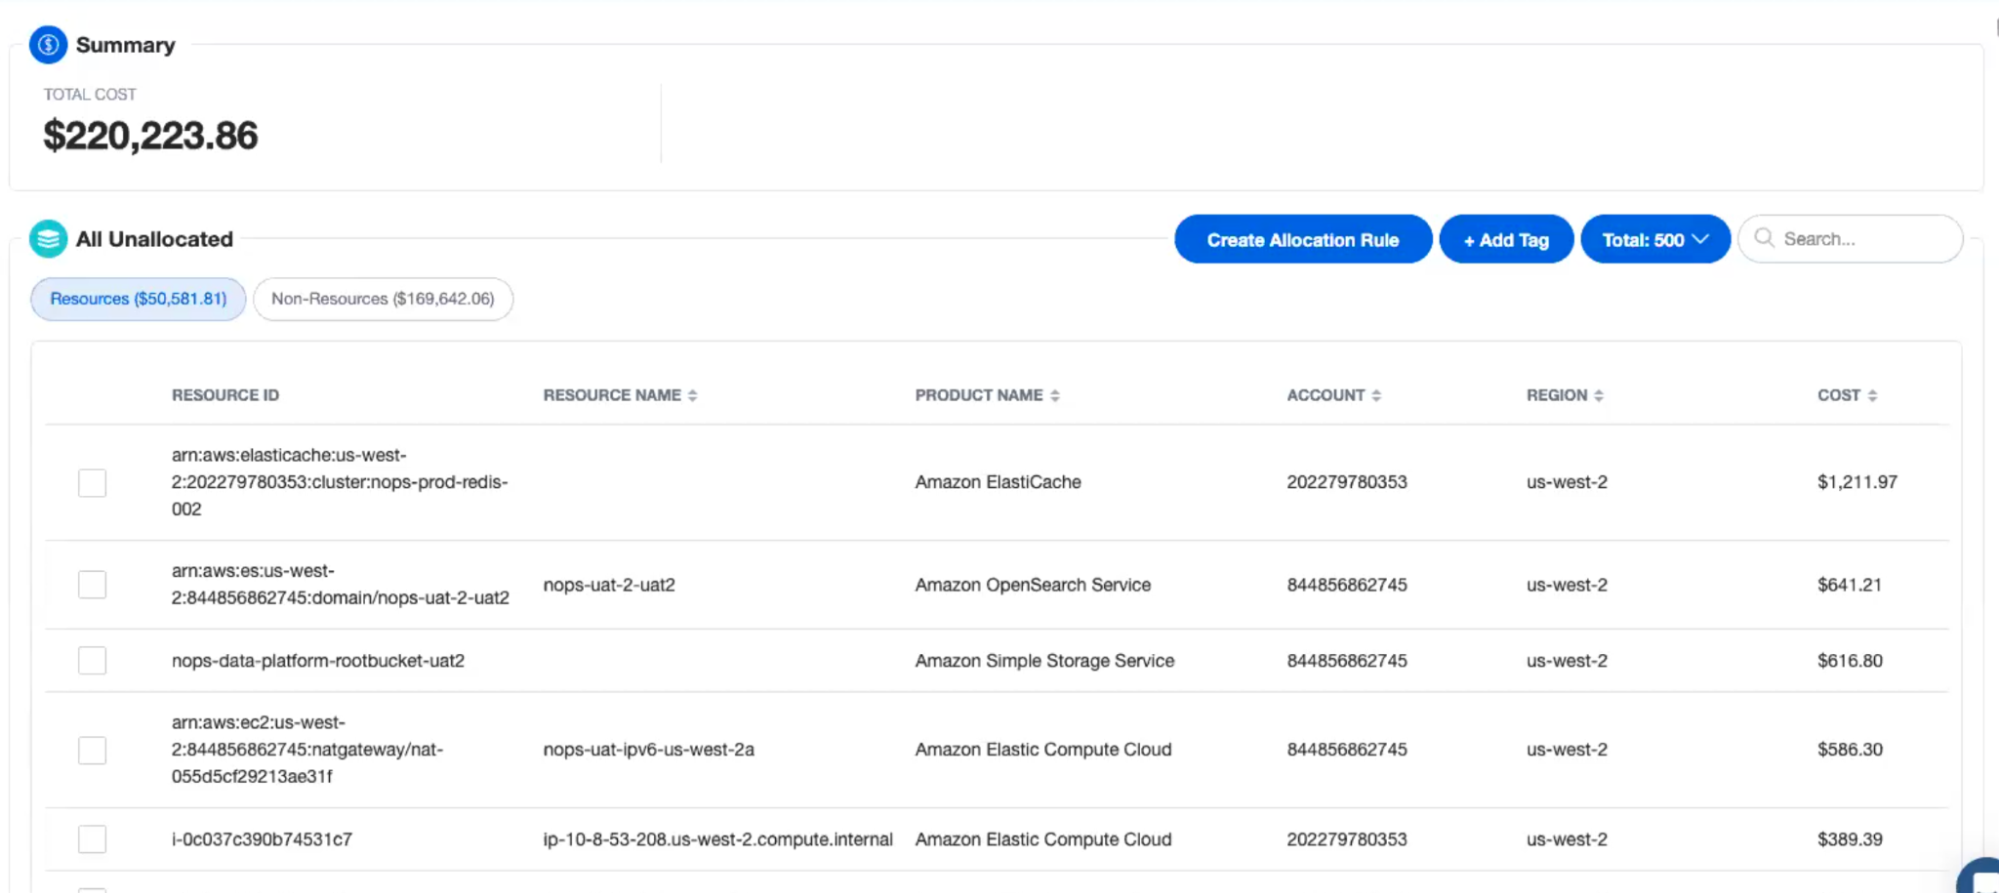
By analyzing an organization’s AWS usage patterns, nOps can provide automation to make changes to optimize costs without sacrificing performance. This can include recommendations and automated provisioning on areas such as optimal instance reservations, unused resources, underutilized instances, and Spot. 

Part 1: Visibility

Part 1: Visibility

In the Crawl phase, teams start with basic cost visibility and reporting. In the Walk phase, they move beyond spreadsheets and disconnected interfaces like Databricks and AWS Cost Explorer to allocating costs directly, i.e. breaking down costs by team, product, feature, or other meaningful cost center and involving more stakeholders in the process. By the Run phase, organizations achieve automated reporting and continuous learning.

Let’s walk through this process in more detail (and illustrate how nOps can help).

Step 1: Tagging & visualizing your Databricks spend

When we come to Databricks, we see that everything is tracked in terms of SKUs and overall spend. (In part 2, we’ll discuss which Databricks SKUs you’re actually using and how to build an efficient workflow).

Tagging & visualizing your Databricks spend

However, a common challenge many of us face with Databricks is understanding how its costs translate into the resources deployed within our AWS accounts. While Databricks offers powerful capabilities, visibility into cost allocation remains a missing piece for many teams.

That’s where the nOps Databricks integration comes in. It automatically ingests and normalizes all of your Databricks spend data, allowing you to see both AWS and Databricks costs in a single pane of glass—something that was previously a manual and time-consuming exercise. This integration not only ingests your Databricks spending but also automatically correlates it with your AWS costs.

Cost Analysis dashboard

A standout feature of Databricks workloads on AWS is that tags flow through seamlessly. This means you can easily tag all of your compute and Databricks workloads. Our team has leveraged this by ingesting and correlating Databricks tags, mapping them to their respective SKUs, and merging them with corresponding AWS resources.

For example, you can quickly view all tags associated with your Databricks spend, including serverless workloads, Photon, job IDs, and run names—critical data points that are otherwise difficult to track.

Step 2: Build cost allocations that have business meaning to you

The second phase of the visibility journey is to allocate costs or create categories that align with your business needs and assign all of your Databricks and AWS infrastructure spend to those meaningful categories (such as engineering budget by environment, data team, R&D, product x, feature y, customer z, etc.)

Build cost allocations that have business meaning to you

Let’s walk through an example of creating a showback, based on how we allocate costs in the real world here at nOps. The process is streamlined because we can prime the showbacks based on the tagging work already done in Step 1. For example, a large portion of our spending is already correlated with an internal cost center tag.

We’ve assigned cost center codes to all departments. Allocating these costs is as simple as that — I created the showback, and now I can see exactly how my spending aligns with these categories.

Daily spend dashboard

For instance, our 101 category represents our centralized platform — I can immediately see how much of my Databricks workloads are allocated to that cost center. 

Part of goal is to identify unallocated Databricks spend and ensure everything is categorized correctly. The cost allocation workflow starts with reviewing unallocated spend and building rules that ensure every dollar is accounted for.

Summary dashboard

For example, I might see $6,729 in Databricks costs that are not yet assigned to any cost center. To analyze this, I break it down by job compute vs. all-purpose compute. I know that all-purpose compute is more expensive, so I can create an allocation rule to categorize it accordingly. For job compute, I might decide to allocate costs evenly across all cost centers, or I could use a custom percentage allocation based on usage patterns. The key takeaway is that even with imperfect tagging, I still have the ability to allocate every dollar of Databricks spend to a cost center that actually means something to my business—and I can refine the methodology with each analysis.

Step 3: Ensure teams continually have the data they need

Now that we’ve categorized and allocated all of our data spend, you might be wondering how that translates into the work we do every day. Let’s go through a few key use cases of how we use these tools here at nOps. 

R&D and COGS: Allocating R&D spend is key to showing how engineering investments contribute to product development. We break out COGS separately from R&D. This allows finance teams to track the real cost of delivering products, making sure that engineering and infrastructure costs align with business objectives.

Catch Cost Anomalies: In early December, we saw a substantial increase in Databricks workload costs. By using nOps, I was able to break down the spend across different cost categories and see the before state to understand the impact. This visibility gave us the ability to react quickly and ensure that unexpected costs were properly attributed. Data and AI workloads can be hard to predict, and costs can spike unexpectedly due to incorrect configurations or unanticipated GPU usage. Having this analysis in place ensures we catch issues early before they affect the budget.

Spend history dashboard

Reports & Alerts To prevent surprises, we set up reports and alerts so key stakeholders have real-time visibility into spending. In this case, I created a Databricks cost center report to ensure our VP of Product and CFO now receive frequent updates. Since we triage our data and AI spend weekly, this allows us to proactively track costs rather than react after an overrun has already happened.

Reports & Alerts dashboard

Budgets Once we’ve categorized and allocated all spend, we can start to set budgets around these costs. Whether you’re slicing the data by environment, product, or cost category (R&D vs. COGS), you can quickly establish budgets to ensure that even difficult-to-track expenses are accounted for. This helps us stay ahead of costs, forecast spending, and ensure financial accountability across teams.

Targets dashboard

These visibility tools help us correlate Databricks and AWS costs, making it easier to provide finance and product teams with meaningful data for financial reporting and planning. For us, this has been transformational—both in how we track spend internally and how our finance teams plan for the future.

About nOps

nOps was recently ranked #1 with five stars in G2’s cloud cost management category, and we optimize $2+ billion in cloud spend for our customers.

Join our customers using nOps to understand your Databricks costs and leverage automation with complete confidence by booking a demo with one of our AWS experts.