Skip to content
.png?width=1920&height=1080&name=Landscape%20(4).png)

Accurately interpreting and analyzing costs is crucial for budgeting, forecasting, and optimizing expenses.
Two common terms in AWS Billing and Invoicing you’ll encounter are “Unblended Costs” and “Amortized Costs”. Despite their importance when it comes to understanding your Savings Plans and Reserved Instances and how they are applied, these concepts can be confusing.
In this post, we’ll show you how your AWS costs are calculated and break down key terms in your bill with real-world examples and expert advice.
You can download the full webinar about demystifying Amortized versus Unblended Costs here.
Amortized versus Unblended Costs: Enablement Session
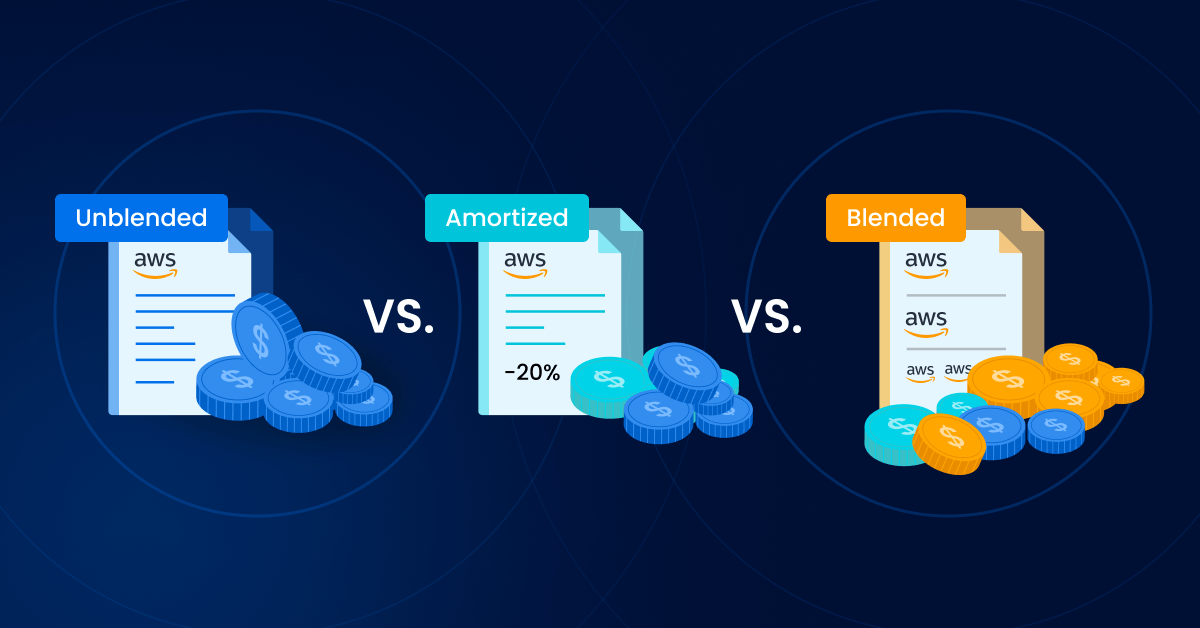
AWS Cost Types: Unblended vs Amortized vs Blended
How much did you spend on EC2 each day over the past month? The answer to this question will look very different depending on which cost type you’re using.
We’ll start with the basics of each cost type before showing you some visualizations and real-world cost data examples to illustrate.
Unblended Costs
Here’s everything you need to know about unblended costs:
- Unblended costs represent your usage costs on the day they are charged to you. From a finance perspective, they are your costs on a cash basis of accounting.
- This is the most used cost dataset.It’s the default option for analyzing costs using AWS Cost Explorer and nOps Cost Analysis.
- Net unblended costs is also the cost dataset presented to you on the monthly AWS invoices.
Amortized Costs
Your amortized costs reflect the effective cost spread across the billing period. They allow you to see the actual cost of your usage after discounts applied. This allows you to more accurately understand what your usage is costing you day to day.
- Amortized costs are needed when there are costs that don’t make sense to view on the same day they were charged as a line item in your AWS bill.
- Typically this cost dataset is used when there are discounted pricing options such as Reserved Instances (RIs) or Savings Plans (SPs) and you’re looking for a way to normalize cost and usage information when operating at scale.
- Amortized costs give you the true cost or effective rate of your resources. (It’s equivalent to costs on an accrual basis of accounting).
- Amortized Costs are also extremely helpful when you want to do proper cost allocation of your cost across different cost centers.
Unblended and Amortized are the most important views to understand, but let’s briefly explain the other cost categories you might run into.
Blended costs
List costs
How are RI & SP billed?
The main difference between unblended and amortized costs has to do with Reserved Instances and Savings Plans.
Once you get a hang of how the billing works, you’ve nailed the theory part of Unblended v/s Amortized.
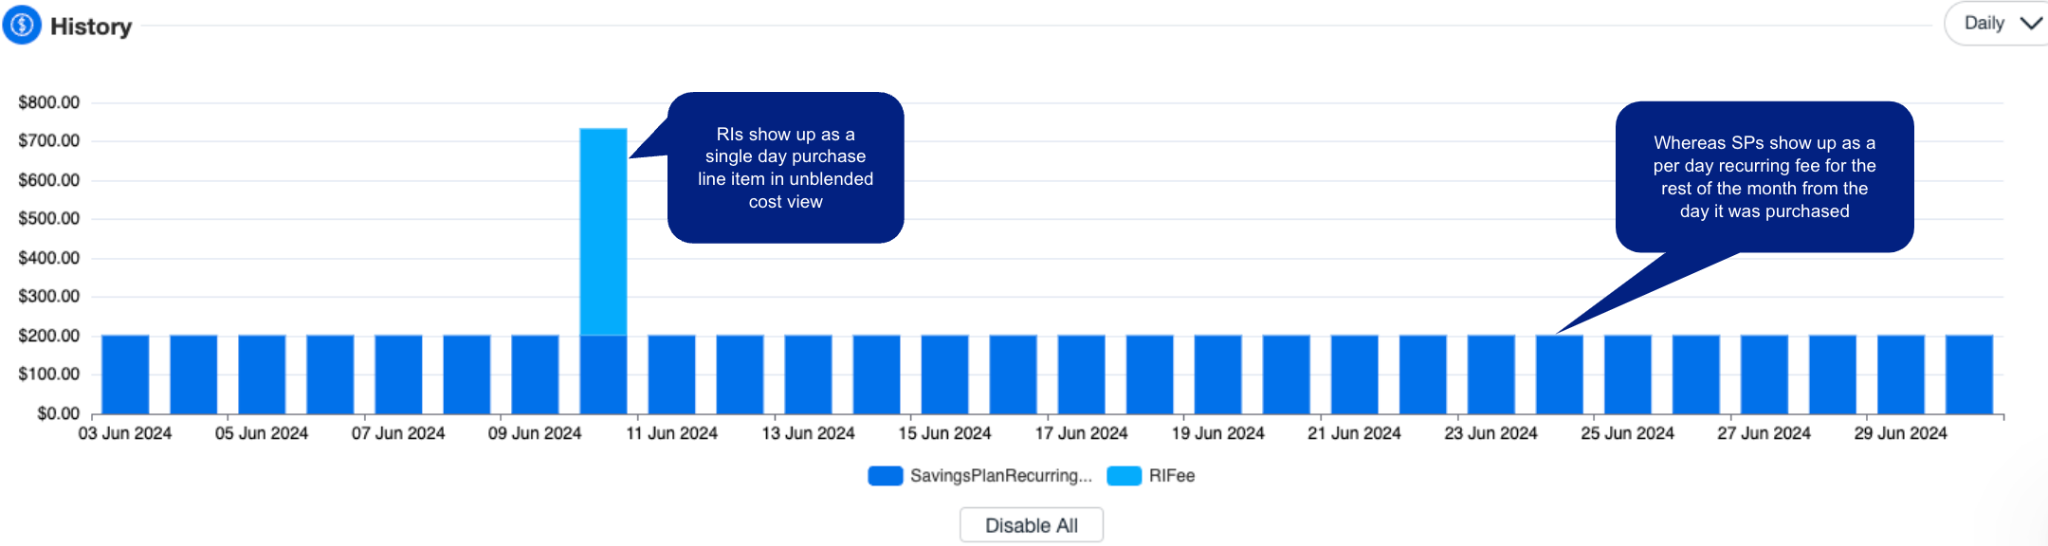
RIs show up as a single day purchase line item in unblended cost view (depicted in light blue). On the other hands SPs (depicted in dark blue) show up as a per day recurring fee for the rest of the month from the day they were purchased.
Note: Reserved Instances and Savings Plans are NOT actual running instances or servers, they are just like a discount coupon purchased in advance to cover the price of running resources throughout the month.
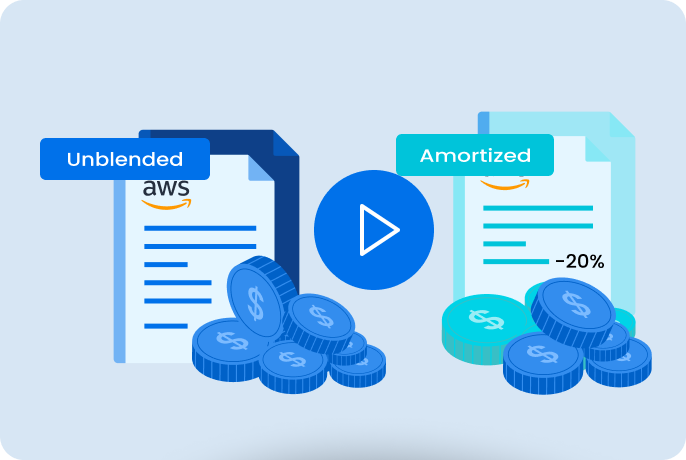
Unblended vs Amortized costs: a visual comparison
So what’s the difference between viewing your RI and SP costs in amortized versus unblended view? Let’s compare visually.
The unblended view (first graph) shows a big spike at the beginning of the month. The amortized view has costs more evenly spread out over the course of the month. Why is that?

In Unblended view, Reserved Instances (RI) fees are shown on the day you are charged. For example, if you purchased a recurring Reserved Instance, then you will see the charge on the first day of each month.
In Amortized view, the costs of Reserved Instances are not shown on the day they were purchased but rather amortized over the billing period. Only the unused portion of your upfront fees and recurring charges are shown on the first of the month.
This means that you’re more accurately seeing the cost of your usage each day using amortized view.
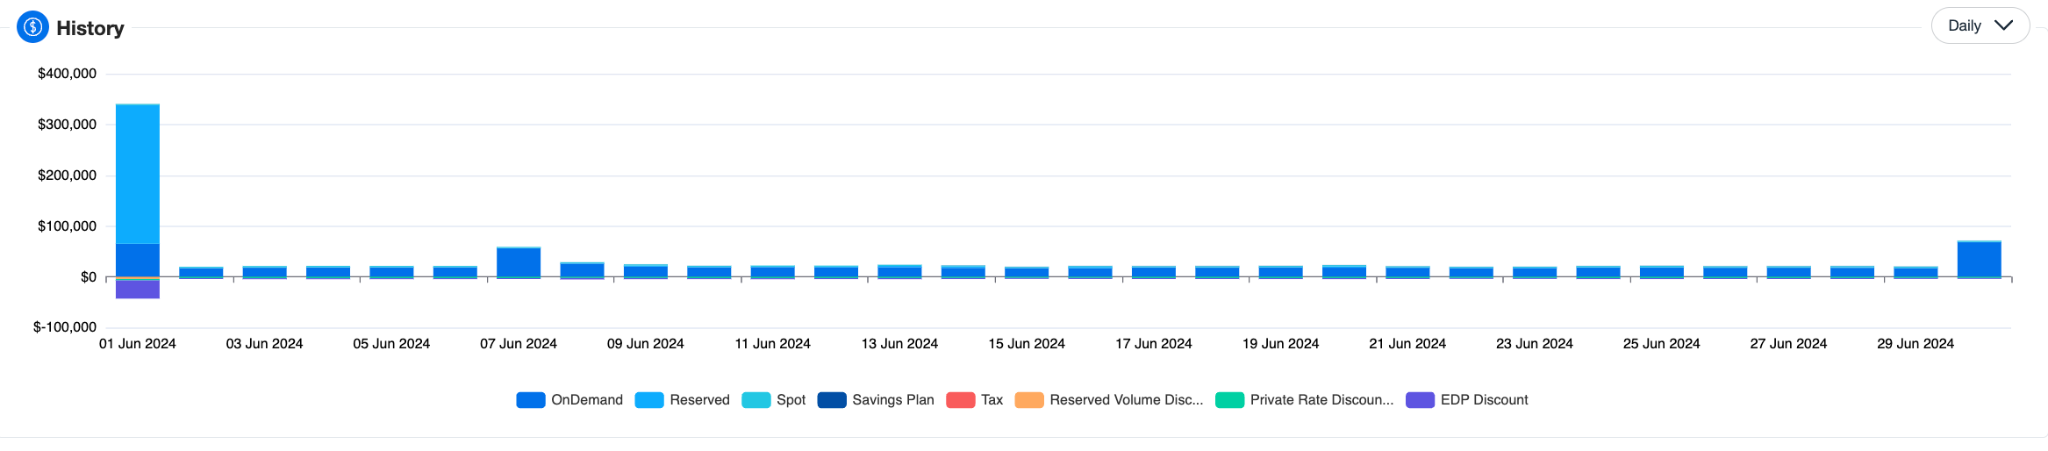
AWS Cost Types: Unblended vs Amortized
Now let’s take a look at some example AWS billing data and a graph of the same billing data to further explain the difference between amortized and unblended costs and how they appear in your AWS bill.
Notice how the RI fee is a single day spike and the Savings Plan fee is a everyday recurring fee. Let’s understand the different line items in the bill.
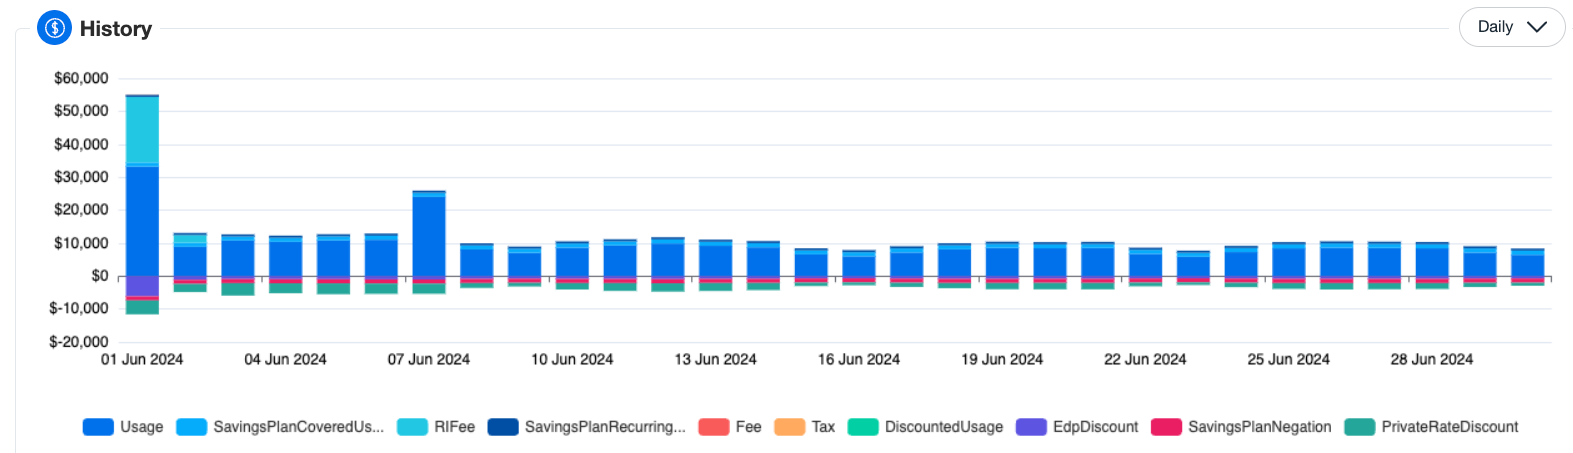
Sample AWS billing data: Unblended |
| |
Total spend | $240,276.32 | The amount of your AWS bill. |
Usage | $290,704,94 | Spend of On-Demand resources |
SavingsPlanCoveredUsage | $37,463.37 | On-Demand spend of resources will will be covered by the Savings Plan fee paid to AWS |
RIFee | $22,237.26 | Recurring monthly fees paid in advance to cover the hourly usage cost of resources throughout the month |
SavingsPlanRecurringFee | $18,720.00 | Committed Savings Plans monthly fee paid as a daily recurring fee |
DiscountedUsage | $0.00 | Actual spend of resources on a per hour basis for which you had Reserved Instance (RI) discounts |
SavingsPlanNegation | -$37,463.37 | Any offset cost through your Savings Plan benefit that’s associated with the corresponding Savings Plan covered usage item. |
The unblended view can be less intuitive to many users. Let’s dive into a few frequently asked questions.
#1: What is the difference between usage and total spend?
#2: Why am I double paying for Savings Plans in the SavingsPlanCoveredUsage line items and the SavingsPlanRecurringFee?
The SavingsPlanCoveredUsage number shows you the cost of the resources that will be covered by Savings Plans for informational purposes, but it is not actually a charge in your bill (it is offset 100% by the SavingsPlanNegation amount — look at the screenshot above to verify that this is the case).
The number you are actually being charged is the SavingsPlanRecurringFee. This is the amount that you committed to spending when buying the Savings Plan, and it does not vary depending on how much you actually use.
Now, let’s take a look at this exact same sample data using the amortized cost type instead of unblended.
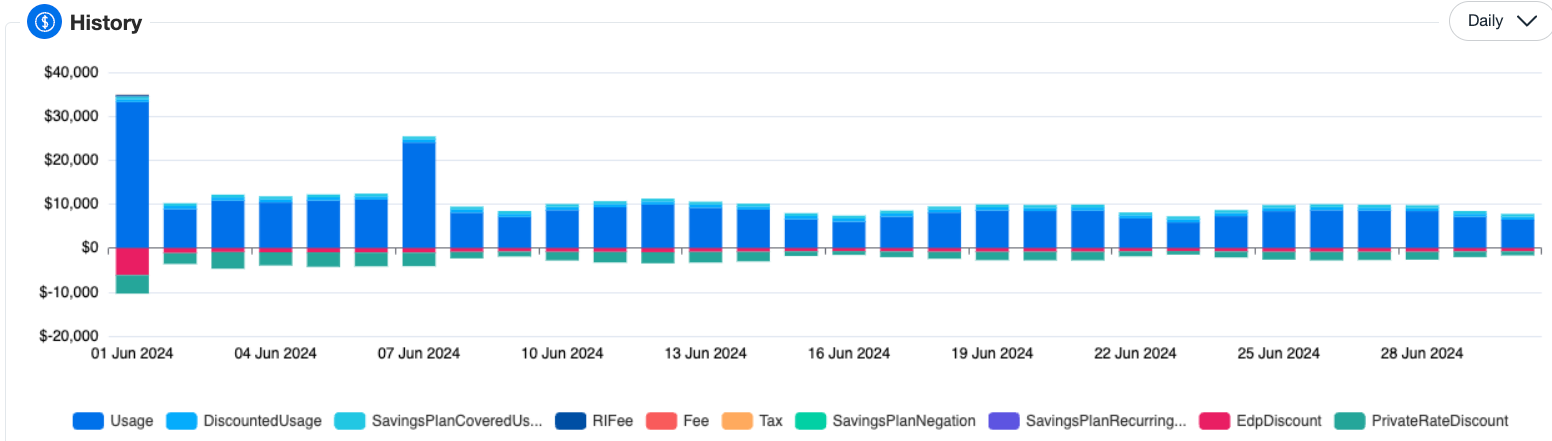
Sample AWS billing data: Amortized |
| |
Total spend | $240,276.32 | The amount of your AWS bill. |
Usage | $290,704,94 | Spend of On-Demand resources |
DiscountedUsage | $21,906.12 | Actual spend of resources covered by RI fee (discounted rate) |
SavingsPlanCoveredUsage | $18,720.00 | Actual spend of resources covered by Savings Plans fee |
RIFee | $332.63 | Unused RIs (if any) – any money that was not able to be used or amortized within the month |
SavingsPlanRecurringFee | $0.00 | Unused Savings Plans (if any) – any money that was not able to be used or amortized within the month |
SavingsPlanNegation | $0.00 | Becomes zero in amortized view |
Why is the amortized view of your AWS cost datasets preferred?
#1: You are seeing your actual costs
#2: It’s easy to see how much of your RIs and SP you didn’t use
#3: Unblended view creates a lot of unwanted confusion in cost allocation reports like showbacks and chargebacks
RIs are one time purchases that are not tied to any resources, and hence can’t be allocated to any resource, app, environment or account in unblended view. Amortized view takes those RI and Savings plans fees and allocates them automatically to the respective resources consuming those costs making cost allocation reports crystal clear.
Note that this is the NUMBER ONE REASON that amortized view is preferred to unblended view.
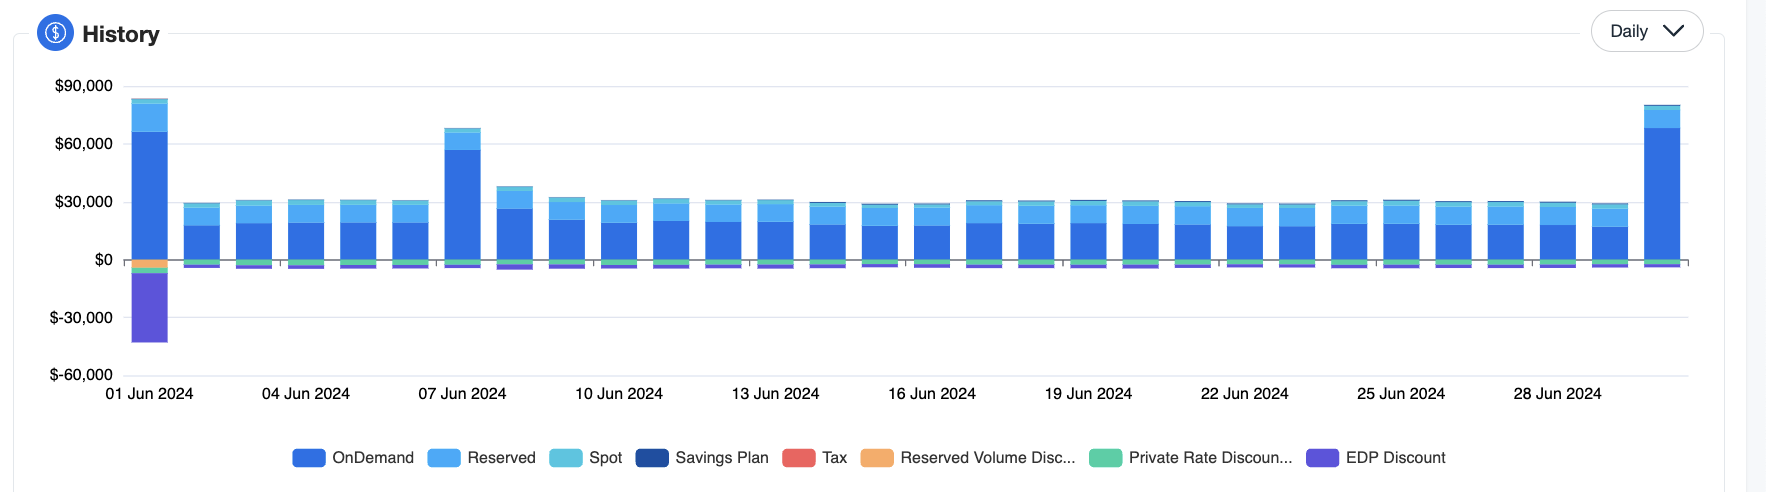
It’s easy and intuitive to understand your AWS bill with nOps
If you find memorizing and deciphering all the item types in your billing data to be time-consuming and complicated, you’re not alone. That’s why we built nOps Business Contexts+ to make it easy to understand your AWS costs.
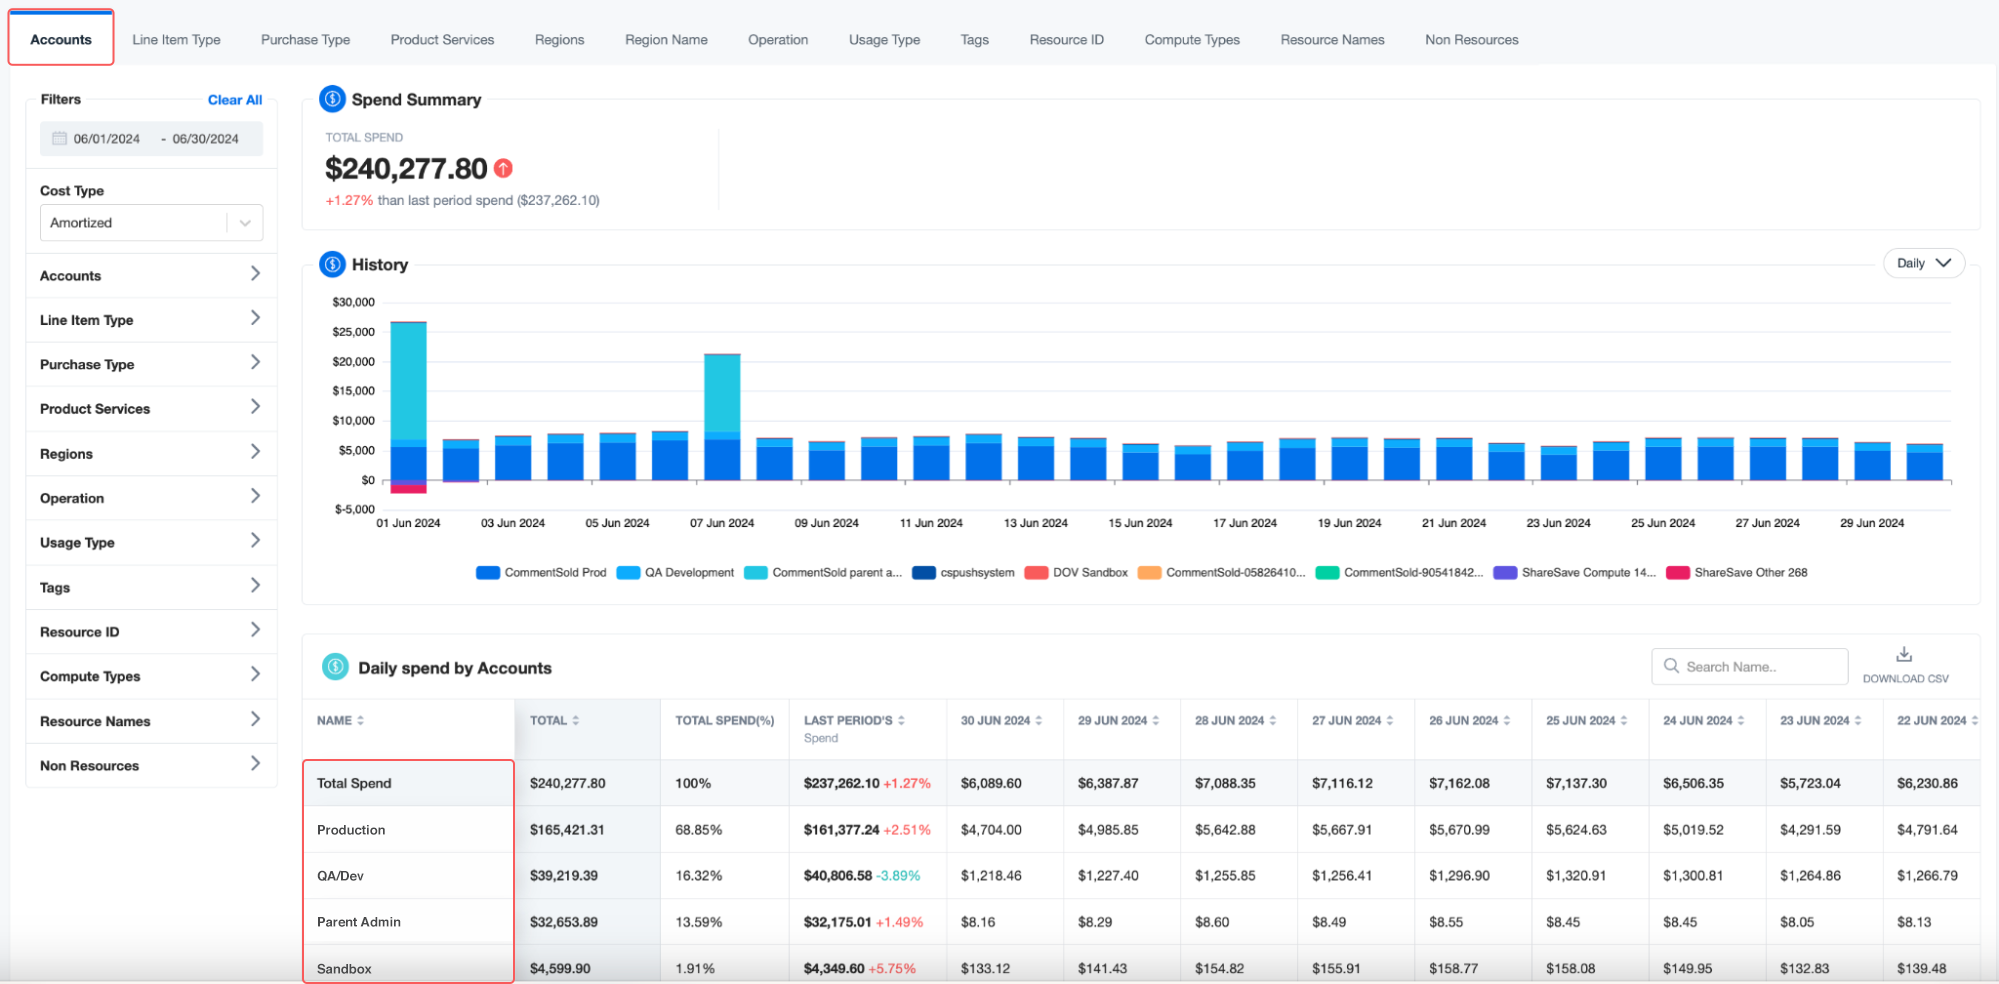
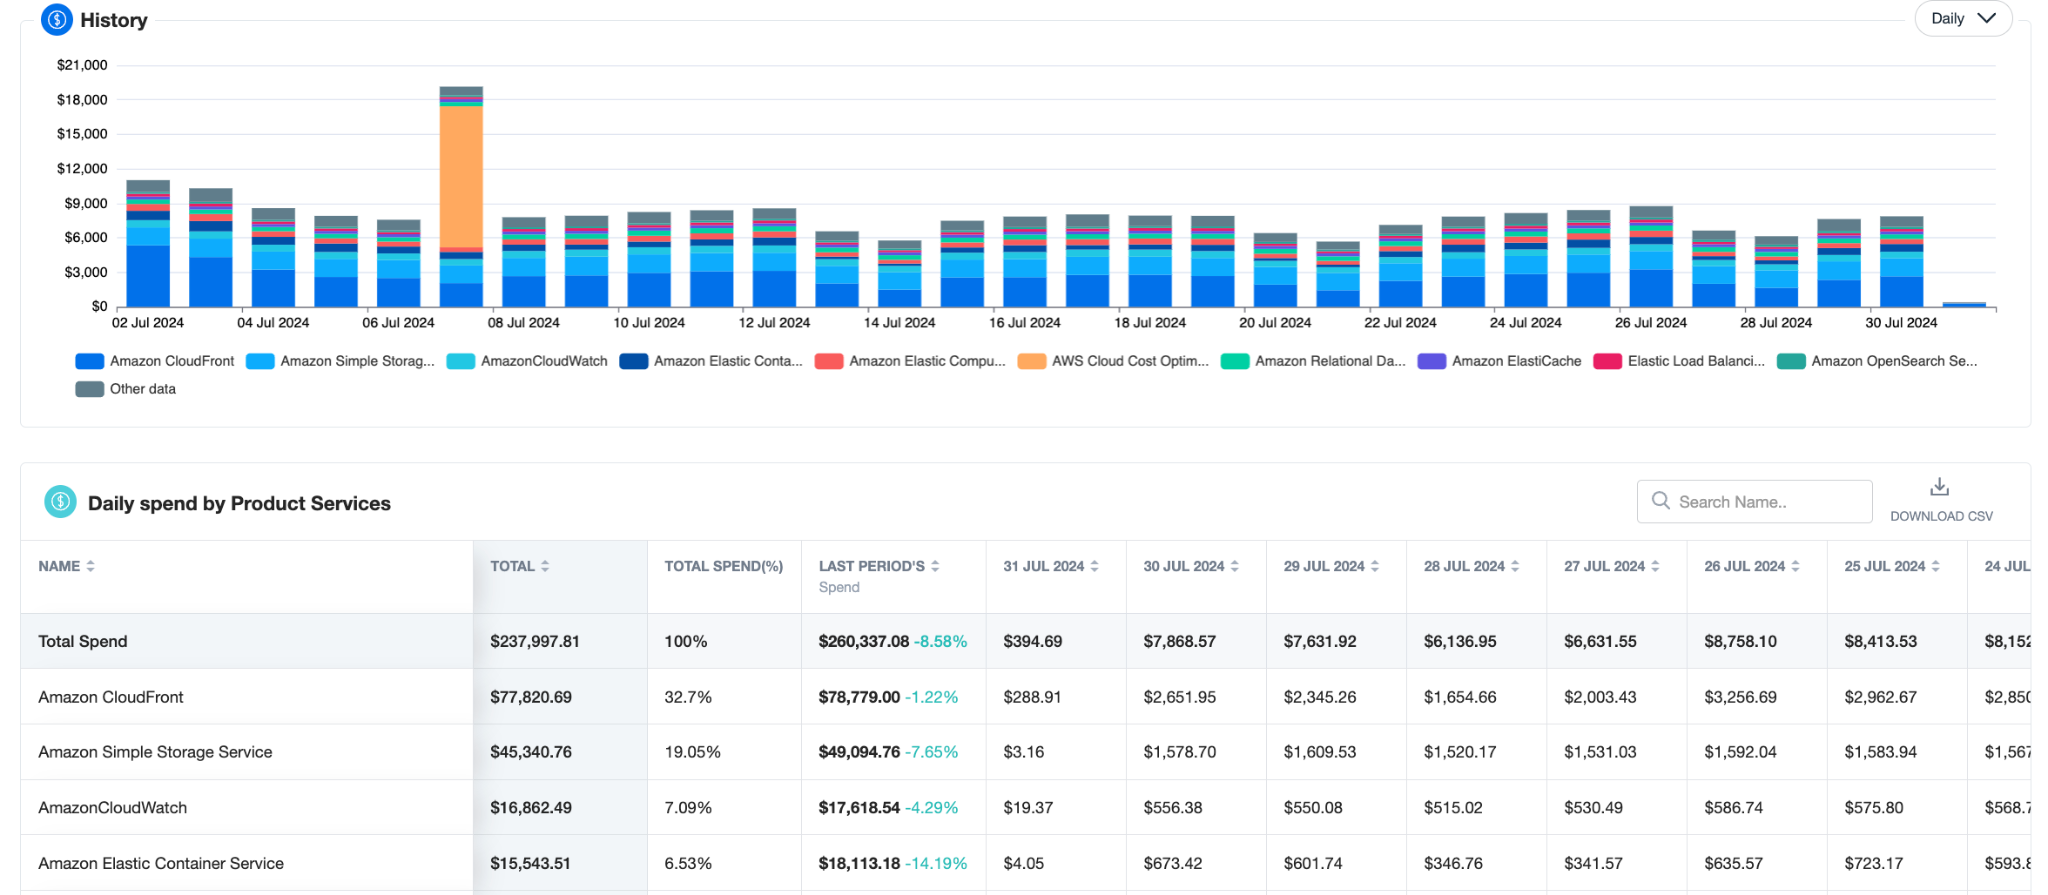
View spend history by your desired granularity, broken down into plain English categories like “On Demand” and “Savings Plan”.
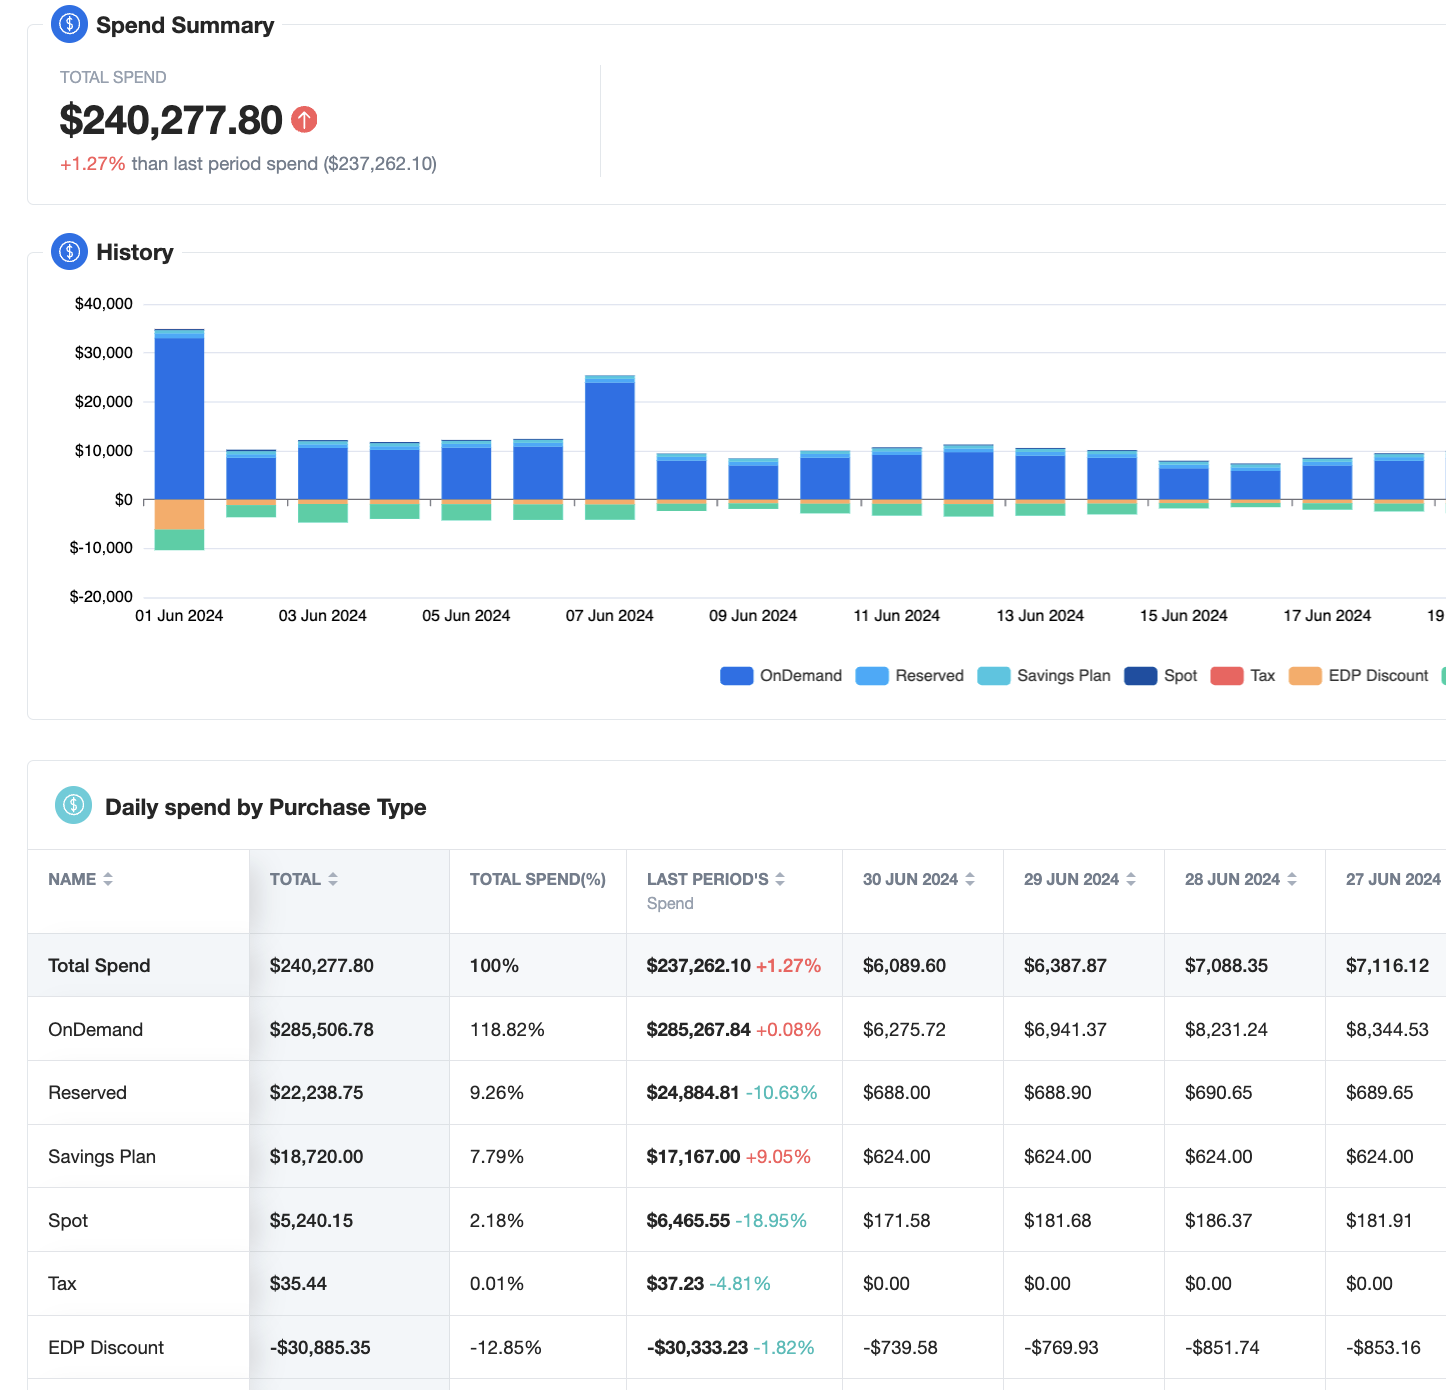
nOps Business Contexts+ comes with over 40 filters and views specifically designed for engineering and finance to quickly and easily get the info you need.
For example, click on “Accounts” to see costs automatically allocated to the account that generated them.
More about nOps Business Contexts+
nOps Business Contexts transforms millions of rows of contextless data into the who, what, when and why of cloud spend — making it easy to get 100% visibility of your cloud costs and usage.
- Allocate 100% of your AWS costs, including EKS. Kubernetes costs are often a black box — no longer with nOps. Understand and allocate your unified AWS spend in one platform.
- Automated resource tagging. You don’t need to have all your resources tagged to allocate costs. Create dynamic rules by region, tags, operation, accounts, and usage types to allocate costs back to custom cost centers.
- 40+ views & filters. Map hourly costs by any relevant engineering concept (deployment, service, namespace, label, pod, container…) or finance concept (cost unit, purchase type, line item, cost allocation tag…).
- Custom reports & dashboards for the whole team. Monthly reporting and reconciliation can take hours; with nOps only minutes. Tailor dashboards and Slack/email reports to your needs, whether you’re a CFO or VP of Engineering.
The best part? nOps is an all-in-one solution for all of your cloud optimization needs: automated commitment management, rightsizing, resource scheduling, workload management, Spot usage, storage optimization, and more.
Join our customers using nOps to understand your cloud costs and leverage automation with complete confidence by booking a demo today!